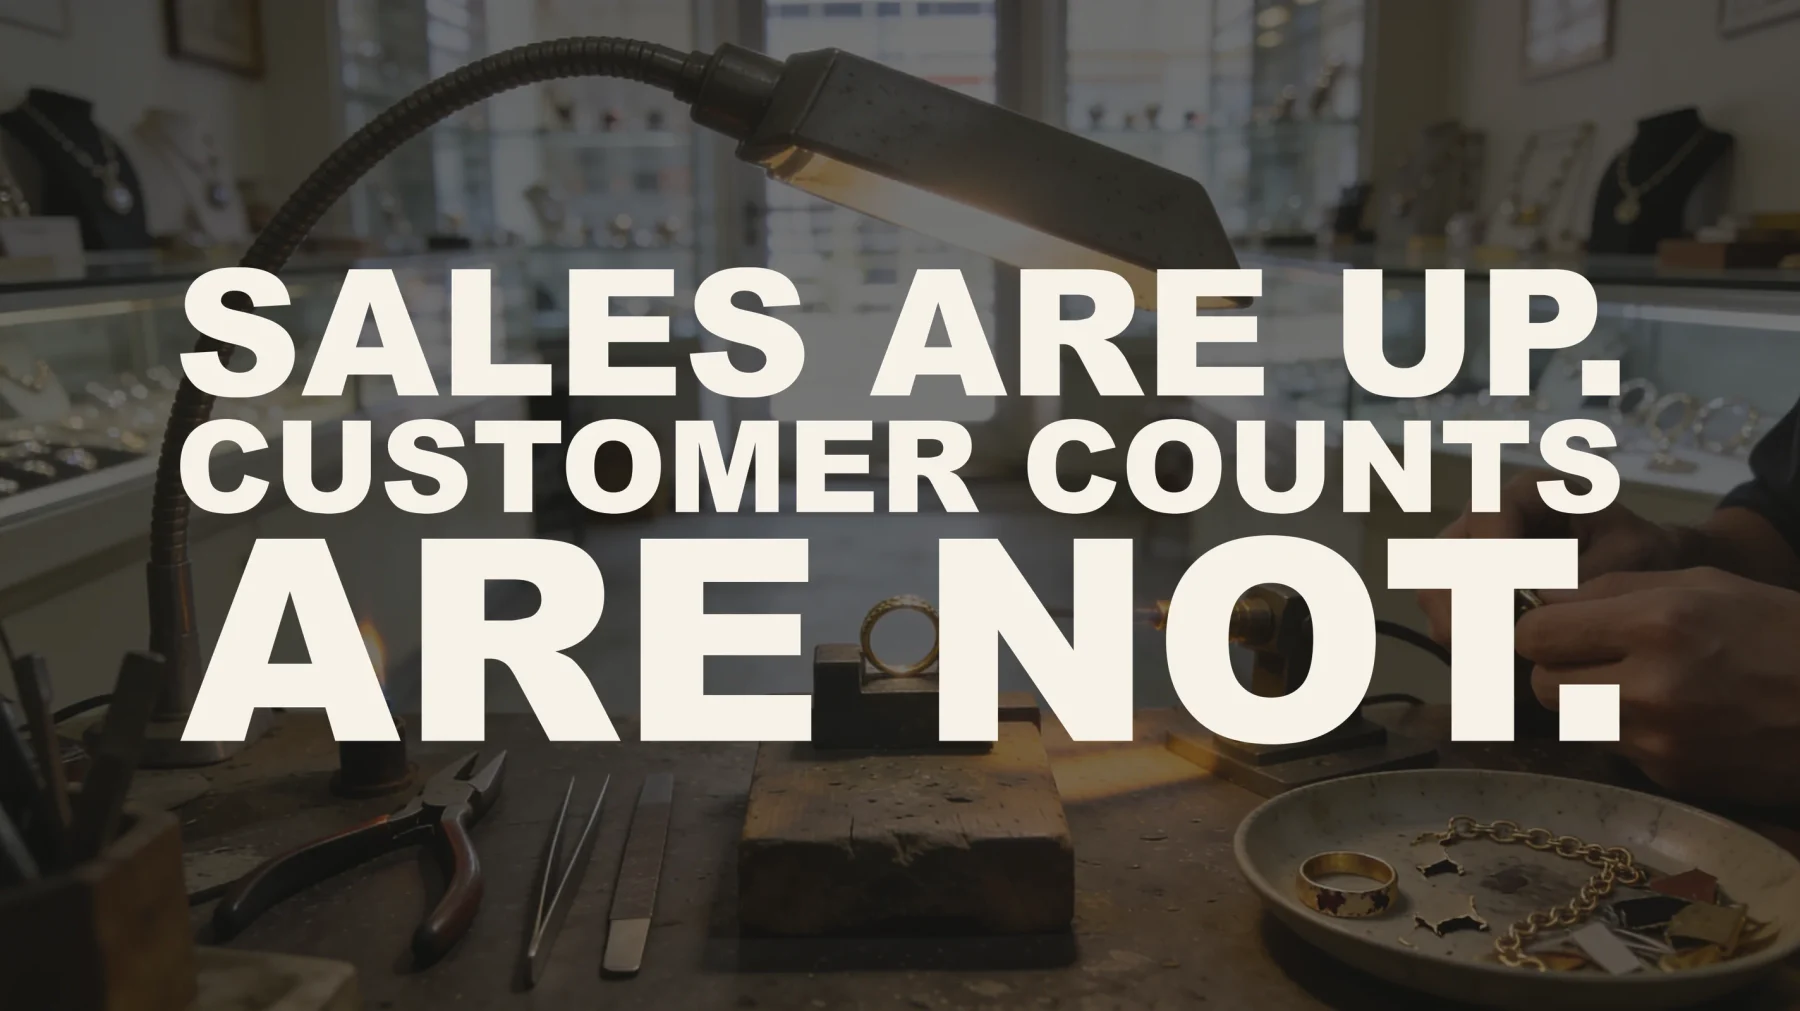
Independent jewelry sales rose 4.7% in 2025 while unit sales fell 5.6% — stores are having a good year while serving fewer people. Traffic, not ticket, is the problem to solve.
Every figure below is attributed, and each one carries a label saying how much weight it can hold. [Measured] means a named study with a real sample stands behind it. [Survey] means a survey, sometimes one that does not publish its sample size. [Not measured] means the industry repeats it constantly and nobody has ever measured it — and there is more of that in jewelry marketing than anyone lets on.
Where no reliable source exists, this says so rather than filling the gap.
This is the first in a series at myjewelrymarketing.com working through what independent jewelers are told about marketing and checking which parts of it anybody has actually measured.
There are fewer of you every year, and it is mostly retirement
At the end of the first quarter of 2026 there were 16,667 retail jewelry businesses in the United States, down from 17,084 a year earlier — a fall of 417, or 2.4%. That is about 1,700 fewer than in late 2021, and the pace has run steadily at roughly 400 to 500 retailers a year since at least 2022. [Measured]
The reflex is to read that as an industry in trouble. The closure data does not support that reading. When the Jewelers Board of Trade breaks the exits down, the great majority are businesses that simply stopped — owners closing up, and a much smaller number selling or merging. Bankruptcies are a rounding error. In the first quarter of 2026, 107 US retail jewelers ceased operations, 17 were consolidated through a sale or merger, and four filed for bankruptcy. In the same quarter 71 new retail locations opened, up from 68 a year earlier. [Measured]
This is not a channel being competed out of existence. It is a channel aging out of it. And for the stores that remain, the arithmetic is straightforward: the same customers, spread across fewer doors.
You will also read that independents are the largest channel in American jewelry retail, usually at "about a third" of sales. We went looking for that figure and could not source it, and this article previously carried it — so it is worth correcting here rather than quietly dropping.
The numbers in circulation run from 30% to 50%: 42% for 2020, 35%, "roughly 30%", and 50%. They appear in aggregation content with no disclosed methodology, and the 50% version is attributed to a named industry report that does not contain it. No reliable measurement of the independent channel's share of US jewelry sales exists that we could find. [Not measured]
What can be counted is the doors: 16,667, down 417 on the year. That is a published count with a method behind it, and it is the number to plan against. The share figure would be nice to have; it is not available, and a range from 30 to 50 is not a fact about your market.
One caution about the market-size numbers you will read
If you have seen a headline saying there are 70,000-plus jewelry stores in America, or that the industry is worth $60 billion, both are real published figures and both come from a different definition. Industry-research firms count by tax classification, which sweeps in sole proprietors, part-time online sellers and anyone filing under the same code. That is how you arrive at an average "jewelry store" with 2.4 employees.
Neither number is wrong. They just are not counting stores with a door, a staff and a trade area. When you are comparing yourself to anything, the 16,667 figure is the one that describes your actual competitive set.
Sales are up. Customer counts are not.
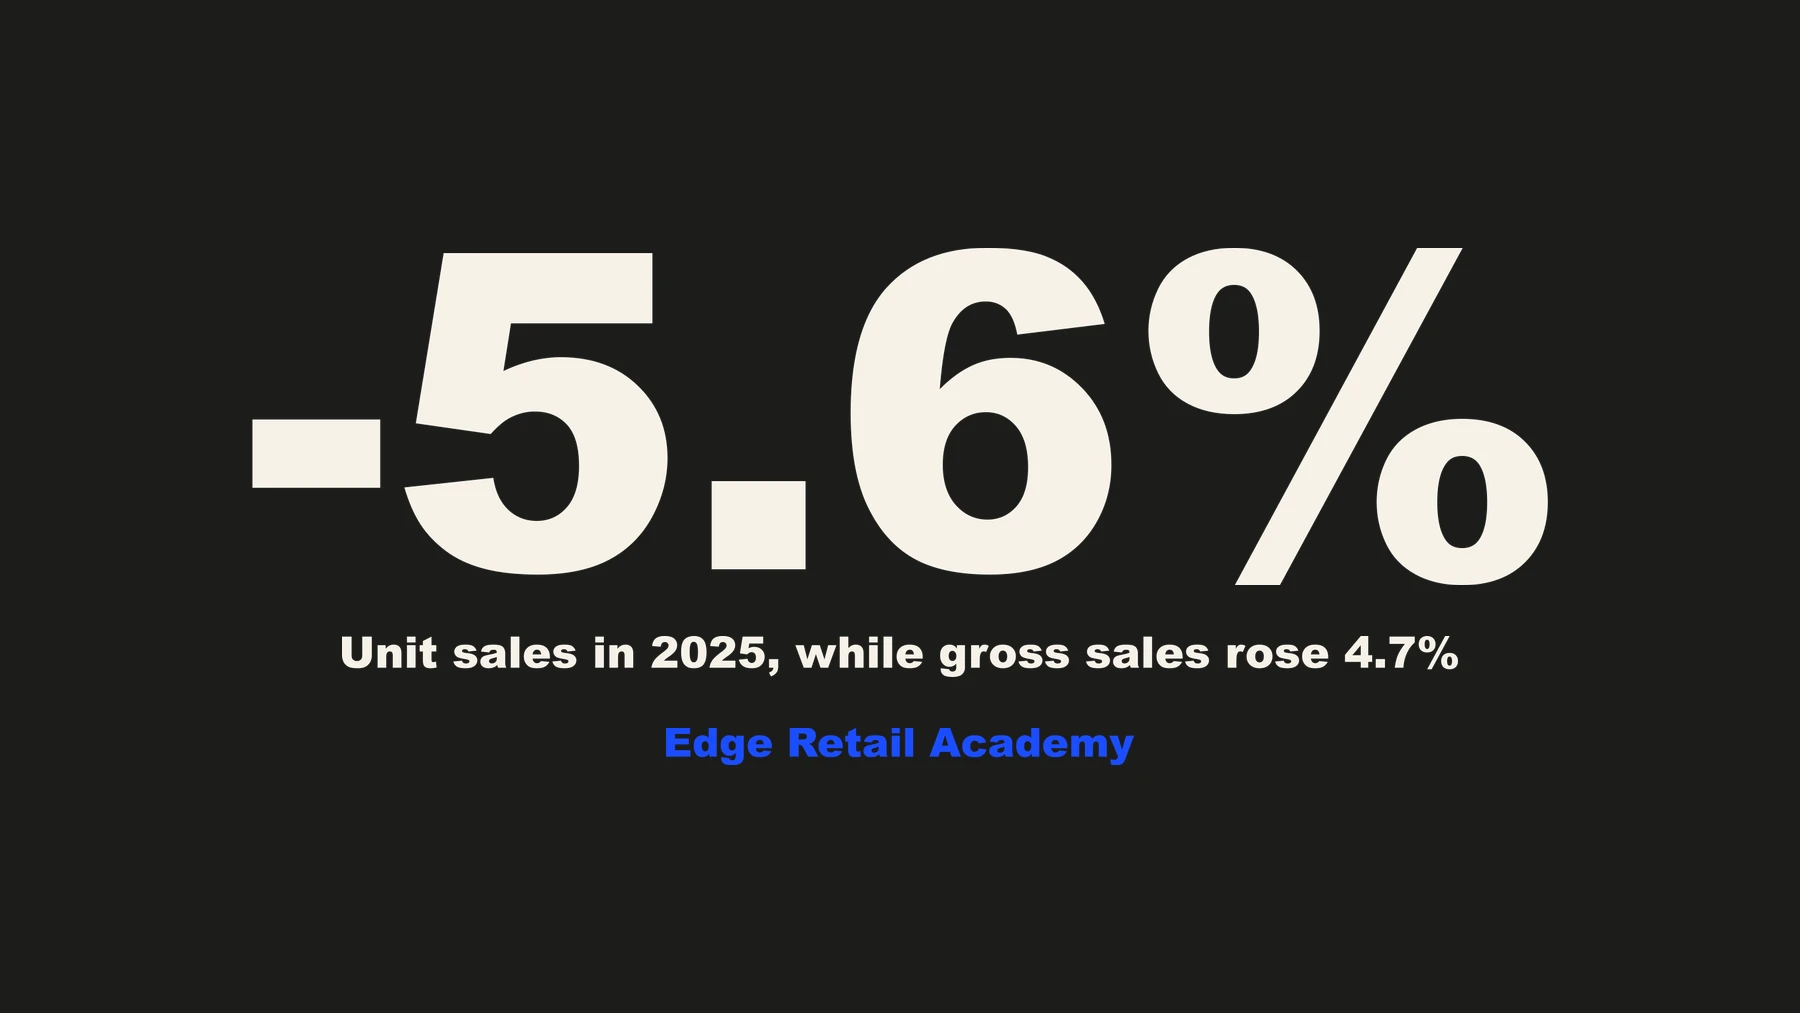
This is the single most important pattern in the independent channel right now, and it comes from point-of-sale data rather than inference. Across US independents in 2025: [Measured]
- Gross sales rose 4.7% — a good year, and better than the chains in several categories.
- Unit sales fell 5.6% — fewer transactions, fewer people through the door.
- The average retail sale rose 10.9% — higher gold and diamond costs, higher carat weights, and a customer trading up.
- Gross profit rose 5.5% — margins held. This is not discount-driven growth.
Then it intensified. Transaction volume fell roughly 15% in the first quarter of 2026, while April sales came in 12% ahead of the prior April. Stores are having a good year on the top line while serving noticeably fewer people.
Two conclusions follow, and they point in the same direction.
First, rising prices are not something to apologise for. Gold and diamond costs are doing most of the work in that average-sale figure, the whole industry is subject to them, and your customers are absorbing them — gross profit rose alongside sales. A store that frames its prices apologetically is undermining a number the market has already accepted.
Second, and more usefully: traffic is now the scarce input, not ticket. The thing that got harder this year is getting people to come in. The thing that got easier is what happens when they do. Any marketing plan built mainly around discounting is aimed at the half of the equation that is already working — and it is fighting the market's actual direction of travel.
The hard part is no longer what they spend once they are in the store. It is getting them into the store.
Where independents are beating the chains
There is a divergence in the 2026 data worth knowing about, because it is flattering and it is real. Independents' colour, custom, remake and one-of-a-kind categories are up double digits, while Signet — the largest specialty jeweler in the country — has guided its fashion business down for its 2027 financial year. [Measured]
That is not a data error. The two channels are exposed to different customers. The mall chains are weighted toward the promotional gift-giving shopper who has pulled back; independents are weighted toward colour, custom and one-of-a-kind, which is where the growth currently is. If you have been reading national retail headlines and feeling behind, check whether the story you are reading is actually about your channel.
Repairs grew three times faster than everything else
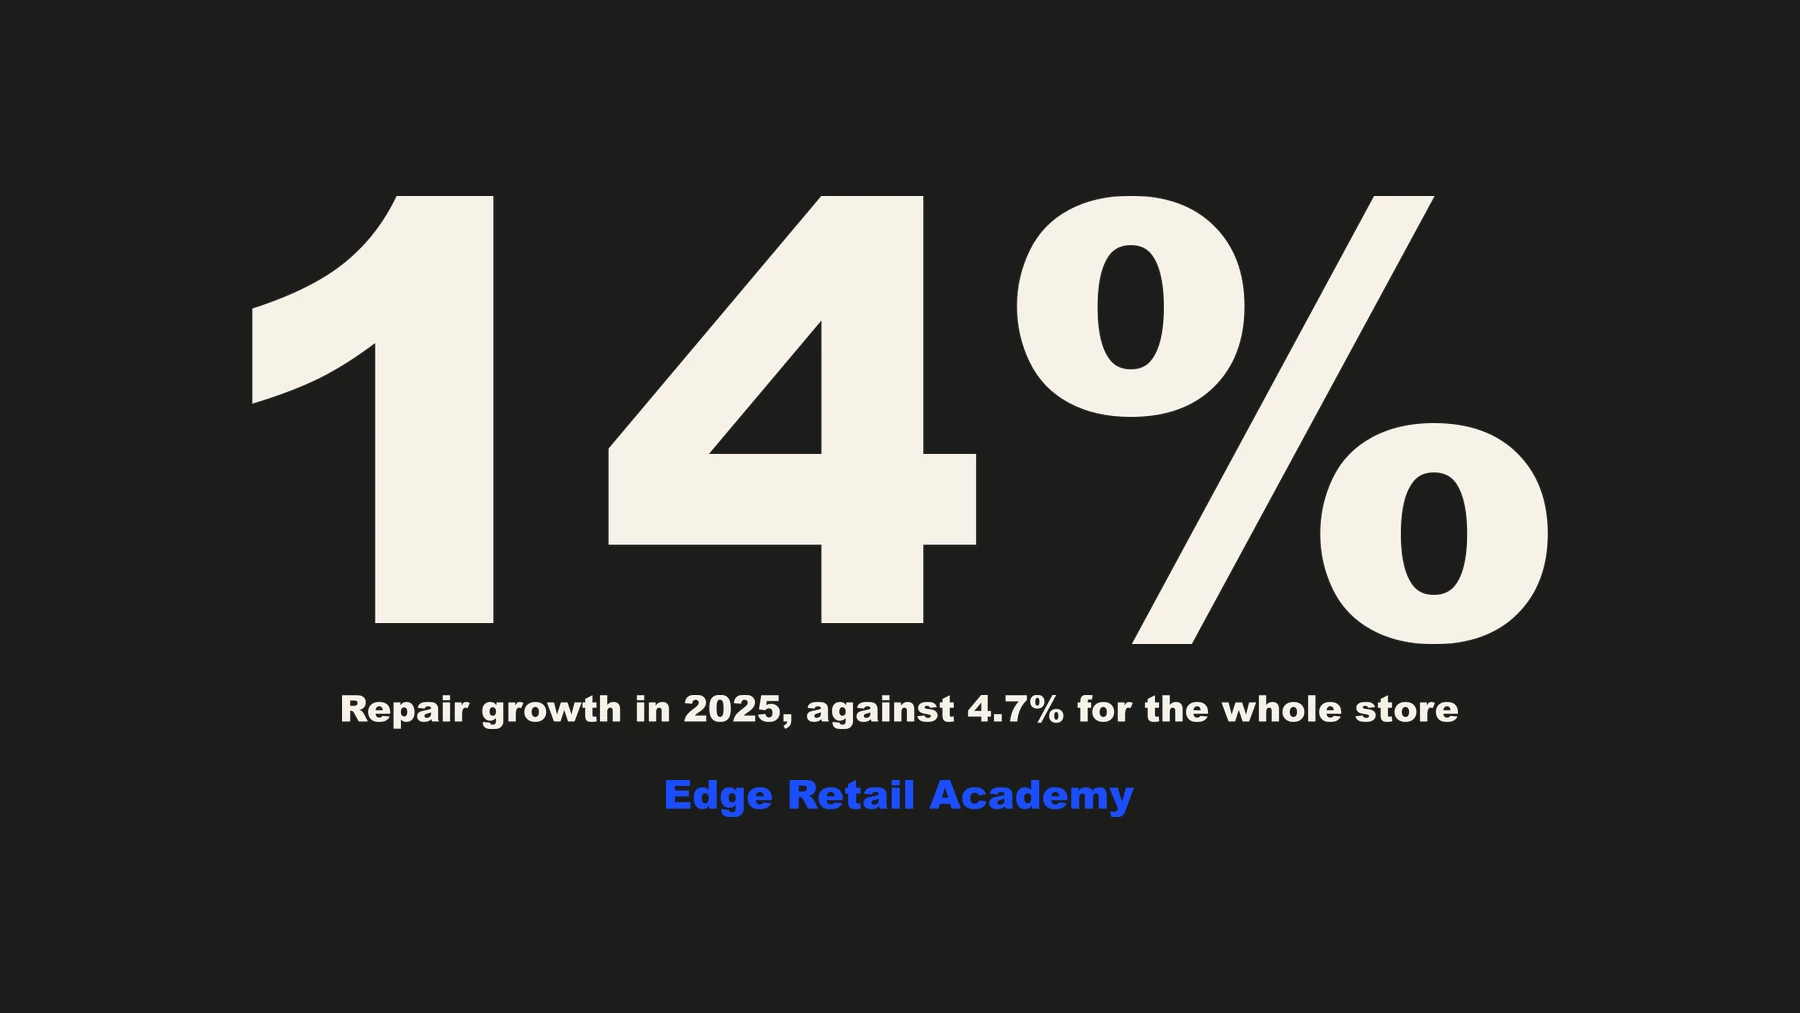
If there is one number in this article to act on, it is this one. Repairs and services grew 14% in 2025, against 4.7% for the channel overall. It is the fastest-growing line in independent jewelry, and it is the only category in your store that is structurally immune to e-commerce — nobody ships a ring to a website to be sized. [Measured]
Underneath it, a genuine change in customer behaviour: 90% of jewelers report increased custom requests, and 65% of those involve melt-and-remake — the customer bringing in their own gold. Record metal prices made old jewelry newly valuable, and that turned a cost headwind into a service revenue line. It is a two-sided flywheel that only spins while gold is expensive, and gold is expensive. [Survey — 117 jewelers]
Repair and remake work also does something no other category does: it brings a person into the store, twice. Once to drop off, once to collect. That is two conversations with a customer who already trusts you enough to hand over something they own, at a moment when traffic is the scarce input.
And it is almost entirely unmarketed. Before-and-after work is the most-recommended Facebook content for an independent jeweler in the trade literature, and it is the least produced. If you are looking for the gap between what your store actually does well and what anybody outside knows about it, this is usually where it is.
The full case for this one — why it is the fastest-growing line, why the customer comes in twice, and how to shoot it without it becoming a project — is in repairs grew 14%, and the rest of your store grew 4.7%.
A practical note on shooting it: transformation is inherently a before and after, so it wants video rather than a single still. Short-form video substantially outperforms single images for this kind of content, and single-image engagement has been falling year on year across the board.
Most jewelry social media statistics do not exist
We went looking for the industry benchmarks everybody quotes. They are blog posts citing blog posts, with no primary methodology anywhere in the chain.
This is worth being blunt about, because it changes how you should read the rest of this article and everything else you are told. Pages that appear to offer "jewelry industry social media benchmarks" are almost always aggregation content — a number invented or misread somewhere, then quoted by the next article, then quoted by the next, until it has the texture of a fact. Follow any of them back and the chain ends in nothing.
Fourteen of the most-quoted Facebook statistics, each followed back to wherever it actually came from, are in fourteen Facebook statistics, traced.
The most striking example is the "golden hour." You have almost certainly been told that the first thirty minutes of engagement on a post determines its reach. That claim underwrites most of the scheduling-software industry. It has never been measured by anyone — not by a platform, not by a vendor, not in an academic paper — and no platform has ever named first-hour engagement as a ranking input. The closest adjacent finding, from six million TikTok posts, is that views accrue over one to five days. That is roughly 120 times longer than the claimed window, and it does not support it. [Not measured]
The two largest vendors in the timing business disclaim their own findings. Buffer: "Posting at the 'right' time is not the secret sauce for content success." Hootsuite: your best time depends on your industry and audience. And not one vendor publishes an effect size — nobody anywhere says posting at the best time yields a given percentage more reach than the worst time. Without that, no posting-time advice can be justified against literally any other use of your twenty minutes.
The seven vendor timing studies, set side by side, are in the golden hour has never been measured by anyone.
For a store selling to a whole town, Facebook is not the old platform
The advice a local jeweler most often receives is to move to Instagram and TikTok. For some jewelry businesses that is right. For a single-location store selling to everybody within thirty miles, the evidence points somewhere else, and it does so for one specific reason: age spread.
Facebook use among US adults, by age: [Measured — n=5,022]
- 18–29 — majority. First fine-jewelry purchases, self-purchase.
- 30–49 — majority. Bridal, anniversary, the self-purchasing customer.
- 50–64 — 74%. Higher-ticket gifting, milestone anniversaries.
- 65+ — 57%. Gift buyers, and your longest-standing customers.
Facebook is the only major platform with majority use in every adult age band. No other feed carries that older tail at scale. Looked at from the advertising side, roughly 59% of the US Facebook audience is 25–54 and 26% is 55 or over — which makes it the one place a store reaches the 35-year-old buying for herself and the 68-year-old buying for his wife in the same post.
There is also a format finding specific to this platform that runs against everything else in social media right now: Facebook is the one platform where static images out-engage video, 5.20% against 4.84% in Buffer's dataset. Everywhere else video dominates. On the platform where your whole trade area actually is, a good photograph still competes. [Measured]
The Reels advice is backwards for a page your size
This is probably the most valuable single correction in this article. You have been told to post Reels. For a Facebook page under about ten thousand followers, a multi-photo album out-reaches a Reel by roughly eight times. [Measured]
The mechanism is not mysterious. Reels are distributed through an open recommendation pool, where a jewelry store in a town of forty thousand competes for attention against full-time professional creators. Photo posts are served primarily to the audience already connected to your page. A small page wins on connected distribution and loses on recommended distribution.
State this one precisely, because it is usually stated wrong. You will see it reported as "albums win for small pages, Reels win for big ones." That is two datasets read as one, and the difference matters if you have a growing page. In the measured range, albums lead in every single band — 8.5 times ahead at 1,000–5,000 followers, narrowing to 1.9 times at 100,000–1,000,000. Reels become competitive above about 100,000 followers. They never overtake. The only evidence of an actual reversal comes from a separate study of 147 large national brands — a population above the top of that table, and not a jewelry store. Anything claiming a crossover inside the measured range is conflating the two studies. The whole table, band by band, is in why photo albums beat Reels for small jewelry pages.
Two more format findings with real samples behind them
- Link posts underperform every other Facebook format by three to four times. Two independent large samples agree, which makes it one of the most robust findings in the whole format literature. If your process is "write a blog post, share the link," that is the weakest available way to use the platform. Put the content in the post. [Measured]
- Carousels earn roughly nine times the saves of other formats. For anything educational — the four Cs, how to care for pearls, what a setting is called — saves are the right measure of success, and the carousel is the form that earns them. [Measured]
And the one that costs stores the most reach: recycled and duplicated imagery is penalised. This is a direct problem for the standard independent-jeweler workflow, which is reposting vendor and designer product photography — often the only imagery a store has. It is a bigger lever than posting time, and almost nobody mentions it. If you take one production decision from this article: photograph your own inventory, on a hand, in your own light. Even indifferently. It will out-reach the supplier's beautiful studio shot that four hundred other stores also posted.
Education outranks everything, and your reputation is the asset
Asked what they most want from brands on social media, 40% of consumers rank educational posts first — ahead of offers, ahead of behind-the-scenes, ahead of everything else. In a category where the customer is spending four figures on something they do not fully understand, that should not be surprising, and yet education is consistently the smallest part of a jewelry store's feed. [Survey — n=2,250]
Meanwhile, here is what jewelers themselves say drives their sales. Asked directly, independent jewelers answered "reputation for service, trust and jewelry-making skill" 82% — against 4% for location, 4% for products, and 6% for "great marketing/sales strategies." [Survey — sample size not disclosed]
Eighty-two percent say reputation is what sells. Six percent say marketing is. Both groups are describing the same thing badly.
Those two findings are usually read as being in tension. They are not. If reputation is what sells — and the people running these stores are almost certainly right about that — then the job of marketing is not to invent a reason to visit. It is to carry an existing reputation further than word of mouth reaches on its own. That is a completely different brief from "run a promotion," and it explains why so much jewelry marketing feels wrong to the people buying it.
It also tells you what to put in the feed. The content that carries reputation is the bench, the staff, the repair that came out beautifully, the customer who came back for the third time, the thing you know about pearls that nobody else in town knows. Not the supplier's catalogue.
One number about responsiveness
73% of consumers say they will switch to a competitor if a brand does not respond to them on social media. Worth knowing because comments and messages asking "how much is this" or "do you have this in stock" are inbound purchase enquiries — as close to a phone call as social media produces. No platform reports them as a metric, so they go uncounted, and what goes uncounted goes unanswered.
How often to post — and an honest note that the trade disagrees
The trade consensus for a single-location independent is 12 to 20 feed posts a month, of which at least 40% video, plus Stories and a set block of time for replying to comments and messages. Larger metros sit at the upper end, where there is more competition for feed space.
But this is practitioner consensus rather than a measurement, and practitioners are genuinely split — some successful stores post daily, others weekly and well. The honest version: consistency matters more than frequency, and a store posting eight good things a month beats one posting twenty reposts. Nobody has measured the crossover. [Not measured]
How much should a jewelry store actually spend on marketing?
This is the most-asked question in the category and it has the worst available answer, so it is worth being straight about both halves.
The honest starting point: there is no current, credible, jewelry-specific benchmark. The most-cited figure in the trade traces back to a Jewelers of America Cost of Doing Business survey putting specialty jewelers at about 4.2% of revenue on advertising and marketing — and that reporting is from 2008. It predates Instagram, the smartphone majority, lab-grown diamonds and the entire paid-social industry. It gets quoted as though it were current. It is not. [Stale]
What is left is general retail guidance, which lands in a wide band: 4% to 12% of revenue, with established stores of twenty years or more typically at the lower end — 5% to 8% — and newer stores needing to spend considerably more to become known at all. That band is broad because the right answer genuinely depends on whether you are defending a position or building one. [Vendor guidance — directional]
What that looks like in practice, at 5% of revenue and at 8%:
- $750,000 a year — 5% is $37,500, or about $3,125 a month. At 8%, $5,000 a month.
- $1,500,000 a year — 5% is $75,000, or about $6,250 a month. At 8%, $10,000 a month.
- $2,500,000 a year — 5% is $125,000, or about $10,417 a month. At 8%, $16,667 a month.
Two things usually surprise owners looking at those numbers. The first is how much the percentage implies in absolute terms — most independents spend well under it. The second is that the figure includes everything: print, radio, sponsorships, the trade show booth, the website subscription, the shop-local advertorial, and whoever is handling social. Add those up honestly before concluding you are underspending, because a lot of stores are already at 5% and simply have it distributed across things they never chose deliberately.
A more useful question than the percentage. Given that units are down across the channel and average sale is up, the useful question is not how much but how much of it is aimed at traffic. Spending that lifts the ticket is aimed at the half of the equation that is already working on its own. If you audit one thing this quarter, audit what share of your marketing budget is genuinely pointed at getting a person through the door for the first time — including repair customers, who arrive twice and are the cheapest traffic in the store.
The lead times are longer than almost anyone plans for
Jewelry is one of the most seasonally concentrated categories in retail, and unlike posting time, the lead times here are partly measurable and consistently actionable. This is the part of the calendar most stores get wrong — not by choosing the wrong moment, but by starting too late for a moment they correctly identified.
Engagement season
About 47% of engagements happen November to February, and 57% of proposers begin researching more than six months out. [Measured — n=10,474 couples]
So bridal content should be live from roughly 1 June for the following season: 26 weeks of continuous presence. For a December proposal, the majority of buyers are already researching by late May or June. A store that starts posting engagement rings in November is arriving after most of that season's buyers have already decided where to look. Of everything in this section, that is the timing figure worth acting on with most confidence.
The 26 weeks laid out week by week — along with why the 47% and the 40% in circulation are two different windows rather than a range, and why the most-quoted version of that figure was published in 2018 — is in for a December proposal, they started looking in May.
Christmas
The peak, and the peak research window opens in October. September and October are where December's consideration is seeded — which makes them the months for education and authority content rather than for product pushes.
Valentine's Day and Mother's Day
Together about 16% of annual sales. Valentine's work is built in January; Mother's Day in March. [Measured]
Summer
Slow retail, wedding season, and the peak window for repair and restoration content. The slack-demand months are when repair marketing earns most — it is the category that produces walk-ins when nothing else is.
Those windows are national. The same calendar built on your own trade area — your postal codes and the published Census figures for them — is what myjewelrymarketing.com/demo/strategy produces for a single store.
Yellow gold, bigger stones, colour, and a lab-grown split
Some of the clearest measured movement in the last two years, with the caveat that a trend with a number attached is rarer than the trade press implies.
- Yellow gold has come back hard. 39% of 2025 engagement rings, up roughly 140% over five years, against 35% white gold and 13% platinum. Independently, 94% of surveyed jewelers name yellow gold the most popular metal in their store. White metals still lead in aggregate at 48%, so this is a shift rather than a replacement.
- Stones are getting bigger, and lab-grown is why. Average centre stone 1.9 carats in 2025 against 1.7 in 2024 — natural averaging 1.6, lab-grown 2.0. De Beers reports average natural diamond jewelry carat weight rising to 1.86 from 1.65 in 2023, with average price per piece up 25%.
- Coloured gemstones and pearls are having a genuinely strong run — double-digit growth at independents, driven by gold-substitution economics, a retailer margin advantage, and a real style cycle. Three independent drivers, which is why this one looks durable rather than faddish.
- Estate, antique and vintage is booming, on four separate drivers: a celebrity anchor, Gen Z secondhand behaviour, tariffs pushing buyers toward resale, and record gold prices making old jewelry newly valuable.
- Custom is now the norm in bridal, not the exception. 90% of 2025 engagement rings were customised or custom-designed. That makes process and CAD content the highest-intent thing an independent can post.
The lab-grown picture has split in two
Treating lab-grown as one trend is now actively misleading, and the point-of-sale data separates it cleanly. At US independents in 2025, lab-grown engagement rings grew 31% in sales and 30% in units, while natural engagement rings fell 4% in sales and 2% in units. But across all lab-grown: +13% sales, +19% units, and average ticket down 5%. All natural: −2% sales, −10% units, average ticket up 9%. [Measured]
Then in January 2026, loose lab-grown unit sales declined for the first time ever, while finished lab-grown jewelry saw units and average prices rise together for the first time. Loose stones are bridal centres; finished pieces are fashion. Lab-grown is maturing out of a price story in bridal and into a volume story in fashion — two different businesses that happen to share a material.
One correction on a widely-repeated strategy: silver is not the escape hatch. The "trade customers down into silver" advice does not match what is happening. Silver and alternative metals at US independents show units down every single month through 2026 — April down 10%, June down 9%, July down 8% — while silver average sale inflates too. Customers are not trading down into silver; the silver customer is buying less silver.
And a broader note worth internalising about all of the above: three-quarters of natural diamond demand has nothing to do with engagement, yet nearly all natural-diamond marketing is bridal-coded. That is a large, cheap gap for an independent who is willing to talk about natural diamonds outside of a proposal.
There is no reliable measured US data on moissanite, salt-and-pepper diamonds, toi et moi, hidden halo or east-west settings. Treat those as styling vocabulary rather than trends with a size.
The channel is changing hands, or not being handed on
The clearest explanation for 1,700 fewer stores is not competition. It is that a generation of owners has reached retirement, and about half of them had no plan for what happens next.
When Jewelers of America surveyed retailers on this, 83% of family-owned jewelry businesses reported an owner over 50 — 38% aged 50 to 59, and 45% over 60. Asked what happens at retirement, 40% said the next generation would take over. 26% had no succession plan at all, and a further 22% intended to sell or simply close. [Survey — n=177 family-owned]
That survey is from 2016, and it should be read as a shape rather than as today's percentages. But the shape has almost certainly deepened rather than reversed: every owner in it is ten years older now, and the closure data — overwhelmingly cessations, barely any bankruptcies — is exactly what that survey predicted would happen next.
Two things follow, and they matter to different readers. If you are the generation coming in, the competitive landscape thins out ahead of you, and the stores closing nearby have customers who now need somewhere else to go. If you are the generation going out, the data says roughly half your peers reached this point without a plan — which is worth one uncomfortable afternoon, whatever you decide.
Either way, it reframes the store count. Fewer doors is not the same as less demand. The customers of a closed store do not stop buying jewelry; they start looking for the next jeweler they can trust. Being findable at that moment is worth more in this channel than in almost any other.
The full closure breakdown — including the 71 stores that opened in the same quarter, and why the succession figures above have to be read as a shape rather than as today’s percentages — is in 1,700 fewer jewelry stores, and almost none of them failed.
What the evidence actually supports doing
Stripped of everything that turned out to be unmeasured, here is what is left — in rough order of how much evidence stands behind it.
- Photograph your own inventory instead of reposting the vendor's. Recycled imagery is penalised on reach, and this is most stores' entire workflow. A mediocre photo of a ring on a real hand in your shop will out-reach the supplier's studio shot that four hundred other stores also posted. Biggest single lever on this list.
- Post repair and remake before-and-afters, as video. Fastest-growing category in the channel at 14%, immune to e-commerce, produces two store visits per job, and the most-recommended Facebook content for an independent. Almost nobody is doing it.
- Use multi-photo albums, not Reels, while your page is small. Roughly eight times the reach under 10,000 followers. Revisit above 100,000, where Reels become competitive — but not before.
- Stop sharing links as posts. Link posts underperform every other Facebook format by three to four times, on two independent large samples. Put the content in the post itself.
- Have bridal content running from June, not November. 57% of proposers start researching more than six months out, and about 47% of engagements land November to February.
- Answer every comment and message, including the nosy ones. "How much is this?" is a purchase enquiry. 73% of consumers say they will go to a competitor if a brand does not respond.
- Make education a real share of the feed, in carousels. 40% of consumers rank educational content first among what they want from brands, and carousels earn roughly nine times the saves of other formats.
- Put people in the frame. Distraction-free product-on-white is a finding about luxury brand audiences. For a store selling to a whole town, the research points the other way — hands, faces, staff, backdrops.
- Stop apologising for prices, and stop discounting to fix traffic. Units are down and average sale is up across the whole channel. The market has absorbed the price. Discount posts aim at the half of the equation that is already working.
And three things to stop worrying about
- The exact minute you post. No vendor publishes an effect size for posting time, the two biggest disclaim their own findings, and the golden hour has never been measured. Post at a sensible hour and spend the saved effort on what is in the post.
- Chasing trending audio and formats. A third of consumers think jumping on viral trends is embarrassing for brands. For a business whose value rests on trust and provenance, the downside is larger than the upside.
- Follower count. Your page's job is to reach the trade area you can actually sell to. Ten thousand connected local followers is a better asset than a hundred thousand scattered ones — and the album finding above means a small connected page has a real structural advantage.
The short version
There are fewer independent jewelers every year, mostly because a generation is retiring rather than because anyone is beating them. The stores still standing are having a good year on the top line while serving fewer people — which makes traffic, not ticket, the thing to solve. The fastest-growing category in the store is repair and remake, and it is the least marketed. Nobody has published a credible current benchmark for what a jeweler should spend on marketing, so the honest range is wide and the better question is how much of the spend is aimed at traffic. And a striking amount of the social media advice aimed at jewelers turns out to have nothing measured behind it, including the two most repeated pieces of it.
None of that requires a bigger budget. Most of it requires photographing your own work, showing the repairs, and starting bridal content five months earlier than feels natural.
Get this for your own store
Every figure above is national. The same analysis for your own trade area — your postal codes, the published Census figures for the people in them, and a Facebook plan built on the research in this article — is free at myjewelrymarketing.com/demo/strategy. Paste your website address and read it in a couple of minutes.
Sources
Compiled by My Jewelry Marketing — myjewelrymarketing.com. Every figure above is attributed below with its publisher, its date and its sample size where one was published.
- Store counts and closures. Jewelers Board of Trade Q1 2026 Vital Statistics report, reported via INSTORE Magazine, "U.S. Jewelry Store Count Drops 2.4%, Now Below 16,700", 14 April 2026. Q1 2026 count of 16,667 against 17,084 a year earlier, a fall of 417 or 2.4%; 107 cessations, 17 consolidations and 4 bankruptcies; 71 new retail openings against 68.
- Broader industry sizing. IBISWorld, Jewelry Stores in the US, 2026 — $60.3bn revenue, 73,980 businesses, 2.4 employees average, on a tax-classification definition.
- The independent channel's share of sales. No reliable source exists. Figures from 30% to 50% circulate in aggregation content with no disclosed methodology; the 50% version is attributed to Hill & Co.'s Business of Jewelry Report, and National Jeweler's coverage of that report, 7 October 2024, contains no such figure. An earlier version of this article stated roughly 35% without a source; that claim has been withdrawn.
- Sales performance. Edge Retail Academy point-of-sale data from approximately 2,000 US jewelry retailers, via INSTORE Magazine and National Jeweler, 2025 full year and monthly 2026 reporting. Signet FY2027 guidance.
- Repairs, custom and melt-and-remake. Edge Retail Academy via INSTORE for the 14% category growth; INSTORE "Jewel360 Report," 28 July 2026, survey of 117 jewelers, for the 90% and 65% figures.
- Social media platform use. Pew Research Center, Americans' Social Media Use 2025 — n=5,022 US adults, fielded 5 February to 18 June 2025.
- Format performance. Socialinsider's Facebook benchmarks, 2026, for the page-size album and Reel comparison; Dash Social's sample of 147 large brands and 257,854 non-promoted posts as the contradicting dataset; Buffer, The State of Social Media Engagement in 2026 — 52 million posts across 200,000 accounts, January 2024 to December 2025 — for stills-versus-video on Facebook and for link-post underperformance; Metricool on single-image decline.
- The golden hour. No reliable source exists. Searched across platform documentation, vendor research and academic databases. The only citable adjacent finding is Socialinsider's analysis of six million TikTok posts from 72,000 accounts showing view accrual over one to five days.
- Consumer preferences. The Sprout Social Index, Q1 2026, n=2,250 consumers, for educational content ranking; Sprout Social's 2025 index for trend-chasing sentiment.
- Jeweler attitudes. INSTORE "The Big Survey 2025: Performance," 5 November 2025, for the 82% reputation figure — the publisher does not disclose a sample size. INSTORE, 11 May 2025, for posting-cadence consensus and Facebook content recommendations.
- Bridal and seasonality. The Knot 2026 engagement research, reported via Rapaport, 19 February 2026, n=10,474 couples.
- Product trends. Rapaport 19 February 2026; De Beers, The Diamond Report for carat weight and price per piece; Tenoris February and July 2026; AGTA on coloured gemstone performance; JCK on estate, antique and vintage.
- Marketing spend. Jewelers of America Cost of Doing Business survey, reported via IDEX Online, for 2008. General jewelry-retail budget guidance of 4% to 12% of revenue from marketing-vendor publications without disclosed methodology.
- Succession. Jewelers of America Business Pulse Survey, March 2016 — n=204 retailers, of which 177 family-owned — reported via National Jeweler.
- Academic. Gao, Choi, Kim, Kim and Chakrabarty, Journal of Interactive Marketing, 2026, on luxury versus mass-market audience response to product and background imagery — a fashion study applied to jewelry by analogy.