We traced fourteen widely quoted Facebook marketing statistics to their origins; none survived as quoted — stale, wrong-platform, misread, or sourceless.
Each figure below carries a label saying how much weight it can hold. [Measured] means a named study with a real sample stands behind it. [Survey] means a survey. [Stale] means it was real once and is too old to quote as current. [Not measured] means the industry repeats it constantly and nobody has ever measured it.
One of a series at myjewelrymarketing.com checking which parts of the advice given to independent jewelers anybody has measured; the wider picture is in the state of independent jewelry retail in 2026.
Why the statistics you read are wrong so often
Because most of them are not statistics. They are sentences that were once near a statistic, republished until the qualifiers wore off.
The mechanism is citation chains: a vendor blog cites a marketing blog that cites a slide that cites a 2016 announcement, and each hop drops the year, the platform, or the sample. By the time the number reaches a jeweler's feed it reads as a law of nature.
There is a newer layer on top. While researching this series we logged fifteen domains whose entire output is machine-written statistic roundups — undated figures, no methodology, precision invented to look researched. Several of them appeared in the top five results for nearly every Facebook marketing query we ran. If you searched any of these numbers this year, you very likely read one.
So this article does the unglamorous thing: it takes fourteen of the most repeated claims and follows each one back to wherever it actually came from.
The stale ones: real once, quoted as current
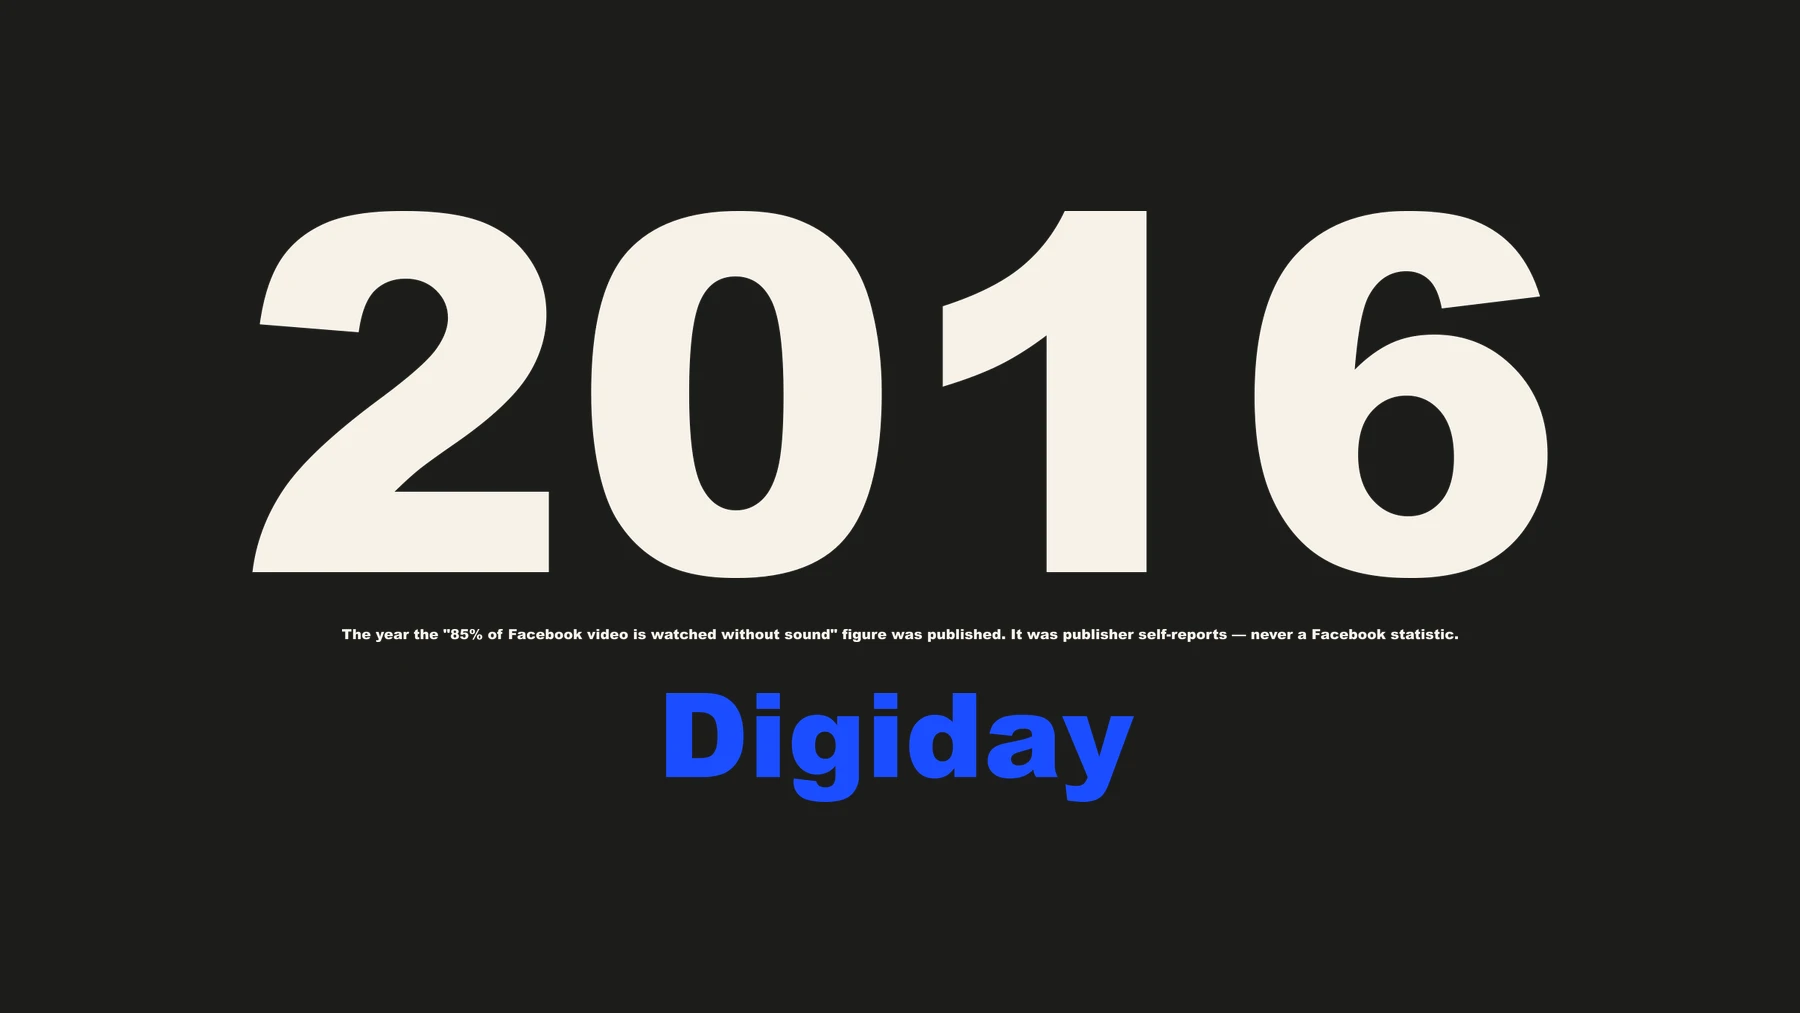
"85% of Facebook video is watched without sound." Published by Digiday in May 2016 — a decade ago — and it was never a Facebook statistic even then. It was individual publishers reporting their own pages, with figures ranging 50–90%. The direction still has support — a 2026 study of 10,110 Facebook Reels found sound-on viewing is far from universal, and captions remain worth adding — but the 85% itself is uncitable. [Stale]
"Facebook Live gets six times the interactions of regular video." From Facebook's own April 2016 announcement promoting the launch of Live. It described the platform of ten years ago, at the moment the platform was promoting the feature, and it has been republished as current ever since. No comparable current figure exists. [Stale]
"1.8 billion monthly Facebook Group engagements." Traces to a Facebook Community Summit announcement of unclear vintage — most likely 2019 to 2021. Nobody republishing it says which year it describes, and no current figure has been published. [Stale]
"Facebook ads cost $0.70 a click and convert at 7.72%." These are real measurements — from WordStream's 2025 benchmark study, where $0.70 is the average CPC for traffic campaigns and 7.72% the conversion rate for lead campaigns. The myth is treating any ad-cost benchmark as durable: Meta's own Q1 2026 results report the average price per ad up 12% year over year. [Measured] A CPC benchmark is a photograph of a moving object; check its date before budgeting against it.
The borrowed ones: right number, wrong platform or wrong country
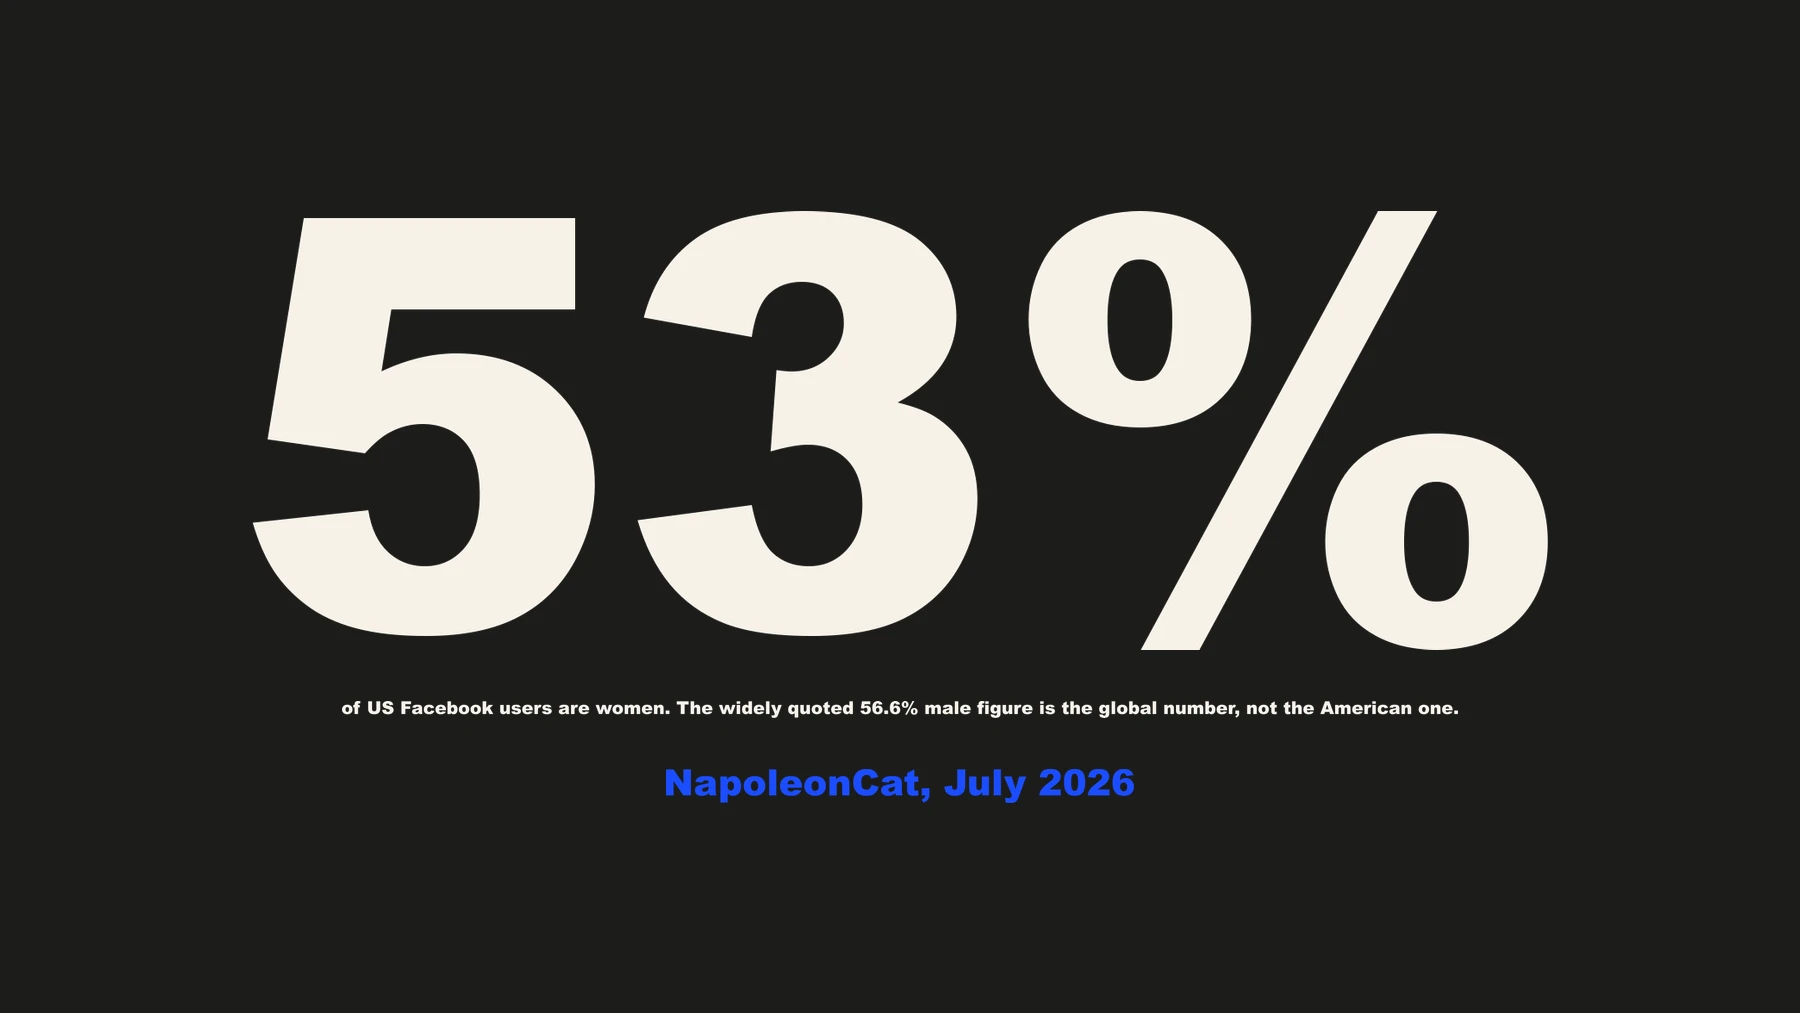
"56.6% of Facebook users are male." That is the global figure. The US audience is majority female — women are 53% of US Facebook users, 53.2% in NapoleonCat's July 2026 count of 294 million American accounts, drawn from Meta's own advertising reach data. [Measured] For a jewelry store this is not a rounding error — it is the inverse, and it changes who you think you are writing for. The largest single block of your local Facebook audience is women, many of them buying for themselves.
"About half the Facebook feed is recommended content." This splices two of Meta's own statements. Mark Zuckerberg's "more than 50%" figure, from an April 2024 earnings call, was about Instagram. Meta's Facebook-specific figure is "more than 20%", from a June 2023 blog post — cite it as a floor with its date attached, since the true current share is very likely higher. [Measured] But 20-something and 50-something describe different feeds, and the difference matters to a small page deciding how much to chase recommendation reach.
"Put faces in your photos — faces boost engagement." True on Instagram, where it comes from: a 2014 academic study of 1.1 million Instagram photos found faces earned 38% more likes. [Measured — on Instagram] The only controlled test that separated the platforms — a 2024 test by That RANDOM Agency — confirmed the Instagram effect and found no statistically significant Facebook effect on any metric. [Measured — small sample] That test is small, so the defensible statement is that the one test separating Facebook from Instagram found no Facebook effect — not that faces never work. What it licenses is real, though: a jeweler with no model and no photographer should not feel that clean product photography is handicapping their Facebook page.
The misread ones: real data, wrong conclusion
"Q4 is 40% of annual jewelry sales." US Census Bureau data puts Q4 at about 34% of annual jewelry-store sales, with December alone at 18–19%. [Measured] One honest caveat, because our correction has a limitation too: the Census stopped breaking out jewelry stores in February 2021, so the monthly shape rests on the 2019 series as a structural baseline. It is still the only official month-by-month measurement that exists, and it says 34, not 40. The six points matter: a store that believes the 40% figure over-concentrates its budget in Q4 and under-markets May — which indexes as the year's second-biggest month.
"30 to 60 seconds is the best-performing Facebook video length." This misreads a distribution of what creators publish as a finding about what performs. The underlying data — OpusClip's analysis of 1.09 million Facebook clips — says 40.2% of published clips run 30–60 seconds; OpusClip's own page calls it the most common length, and the republished versions quietly promote "most common" to "best-performing". [Measured — but it measures behaviour, not performance] The one study that measured performance found the opposite direction: shorter videos reached further, driven by completion rate — though at n=40 that is directional, not a benchmark. [Measured — n=40]
"47% of proposals happen in engagement season — The Knot." The number is real and the attribution is wrong, which makes it wrong twice as quoted. Tenoris point-of-sale data measures 47% of engagements across a seventeen-week November-to-February window [Measured]; The Knot's 2026 study of 10,474 couples puts 40% of proposals in a twelve-week Thanksgiving-to-Valentine's window [Survey — n=10,474]. Two different windows, two different measurements, routinely spliced into one statistic. We took this one apart properly in the engagement-season calendar.
The empty ones: no source at all
Four claims circulate with nothing behind them. Not a stale study, not a misread one — nothing.
- "90 to 120 seconds is peak Reels engagement." Attributed, where it is attributed at all, to "article analysis". No study exists. [Not measured]
- "90% of consumers consider user-generated content in purchase decisions." Sourced to a UGC software vendor with no published methodology. [Not measured]
- "Instagram carousels achieve over 10% engagement." Untraceable, and implausible as stated — no benchmark study of brand accounts reports typical engagement anywhere near it. [Not measured]
- "360-degree product photography lifts conversion and cuts returns." The vendor guide asserting it publishes no percentages, no studies and no attribution whatsoever. [Not measured]
None of this proves the opposite, and that is the point: a claim with no measurement behind it is not false, it is unknown, and unknown is not a thing to budget against.
Two more belong on this list and each has its own article. The claim that Reels overtake photo albums as pages grow is two datasets read as one — taken apart in why photo albums beat Reels for small jewelry pages. And the biggest of them all, the "golden hour" behind every posting-time guide, is in the golden hour has never been measured by anyone.
How to check a statistic before you build a plan on it
Five questions, in the order they catch things. Each one would have caught several of the fourteen above.
- Ask for the year. Most of the numbers above fail here alone — 2014, 2016, "unclear vintage". A platform statistic more than two or three years old describes a different platform.
- Ask which platform, and which country. Instagram findings applied to Facebook, and global figures applied to the US, are two of the commonest swaps — and both appeared above.
- Ask whether it measures performance or behaviour. "40% of videos are 30–60 seconds" describes what people publish, not what works. The two read identically in a listicle.
- Ask who measured it, and what they sell. A UGC vendor finding that UGC works, and a scheduling vendor finding that timing matters, are not neutral measurements. They may still be right — but the burden of proof is theirs, and "no methodology published" means they have not met it.
- Ask for the sample. A named n — 10,474 couples, 1.09 million clips — is checkable. "Studies show" is not a sample.
The short version
We traced fourteen of the most-quoted Facebook marketing statistics to their origins and none survived as quoted. Four are stale — including the "85% watched without sound" figure, which is 2016 publisher self-reports, and Facebook's own "6x Live interactions" claim from the month it launched Live. Three borrow from the wrong place: the male-majority audience figure is global (the US audience is 53% female), the half-recommended-feed figure is Instagram's, and the faces rule failed the only test that separated Facebook from Instagram. Three misread real data — Q4 is 34% of jewelry sales, not 40%; the "best video length" is actually the most common video length; and the 47% engagement-season figure belongs to Tenoris, not The Knot. Four have no source at all. Before budgeting against any platform statistic, ask for the year, the platform, the country, the seller and the sample.
Get this for your own store
The reason these numbers spread is that checking them is work — and the same applies to knowing which of them would even matter for your store. A marketing analysis built the other way, from your own postal codes and the published US Census figures for the people in them, with every figure labelled the way this article labels them, is free at myjewelrymarketing.com/demo/strategy. Paste your website address and read it in a couple of minutes.
Sources
Compiled by My Jewelry Marketing — myjewelrymarketing.com.
- The sound-off figure and its origin. Digiday, "85 percent of Facebook video is watched without sound", May 2016 — publisher self-reports ranging 50–90%, not a Facebook measurement.
- The Live interactions claim. Facebook Newsroom, "Introducing New Ways to Create, Share and Discover Live Video on Facebook", April 2016.
- Ad cost benchmarks and their movement. WordStream, "Facebook Ads Benchmarks 2025"; Meta, First Quarter 2026 Results — average price per ad +12% year over year.
- US Facebook audience by gender. NapoleonCat, "Facebook users in United States of America", July 2026 — 294 million users, 53.2% women, from Meta advertising reach data.
- The recommended-content figures. Meta AI, "The AI behind unconnected content recommendations on Facebook and Instagram", June 2023 — "more than 20%" for Facebook; Mark Zuckerberg's "more than 50%" Instagram figure from the Q1 2024 earnings call, reported via Benzinga, April 2024.
- The faces studies. Bakhshi, Shamma & Gilbert, "Faces Engage Us", CHI 2014 — 1.1 million Instagram photos, +38% likes; That RANDOM Agency, "Do Faces Boost Social Media Post Performance?", November 2024 — the platform-separated test, small sample.
- Jewelry seasonality. US Census Bureau, Retail Sales: Jewelry Stores (MRTSSM44831USN), via FRED — monthly series, January 1992 to February 2021; 2019 used as the structural baseline since the series ended with the NAICS revision.
- Video length distribution. OpusClip, Facebook video research, 2026 — 1,089,611 Facebook clips, 40.2% running 30–60 seconds; a distribution of published lengths, not a performance result.
- Engagement-season measurements. Tenoris point-of-sale data via INSTORE Magazine, February 2026 — 47% of engagements, November–February; The Knot 2026 Real Weddings Study, n=10,474 — 40% of proposals, Thanksgiving–Valentine's.
- Reels sound and retention, referenced in passing. Emplifi, "Facebook Reels: What Drives Views and Stops the Scroll", March 2026 — 10,110 Facebook Reels across 704 brand pages.
- The statistic-farm observation. My Jewelry Marketing's own 2026 research log: fifteen domains of machine-written statistic roundups recorded, several appearing in the top five results for nearly every Facebook marketing query run. Domains recorded internally rather than named here.
- Claims with no source. The 90–120-second Reels figure, the 90% UGC figure, the 10% carousel figure and the 360-degree photography claims were searched across platform documentation, vendor research and academic databases; no methodology was found behind any of them.