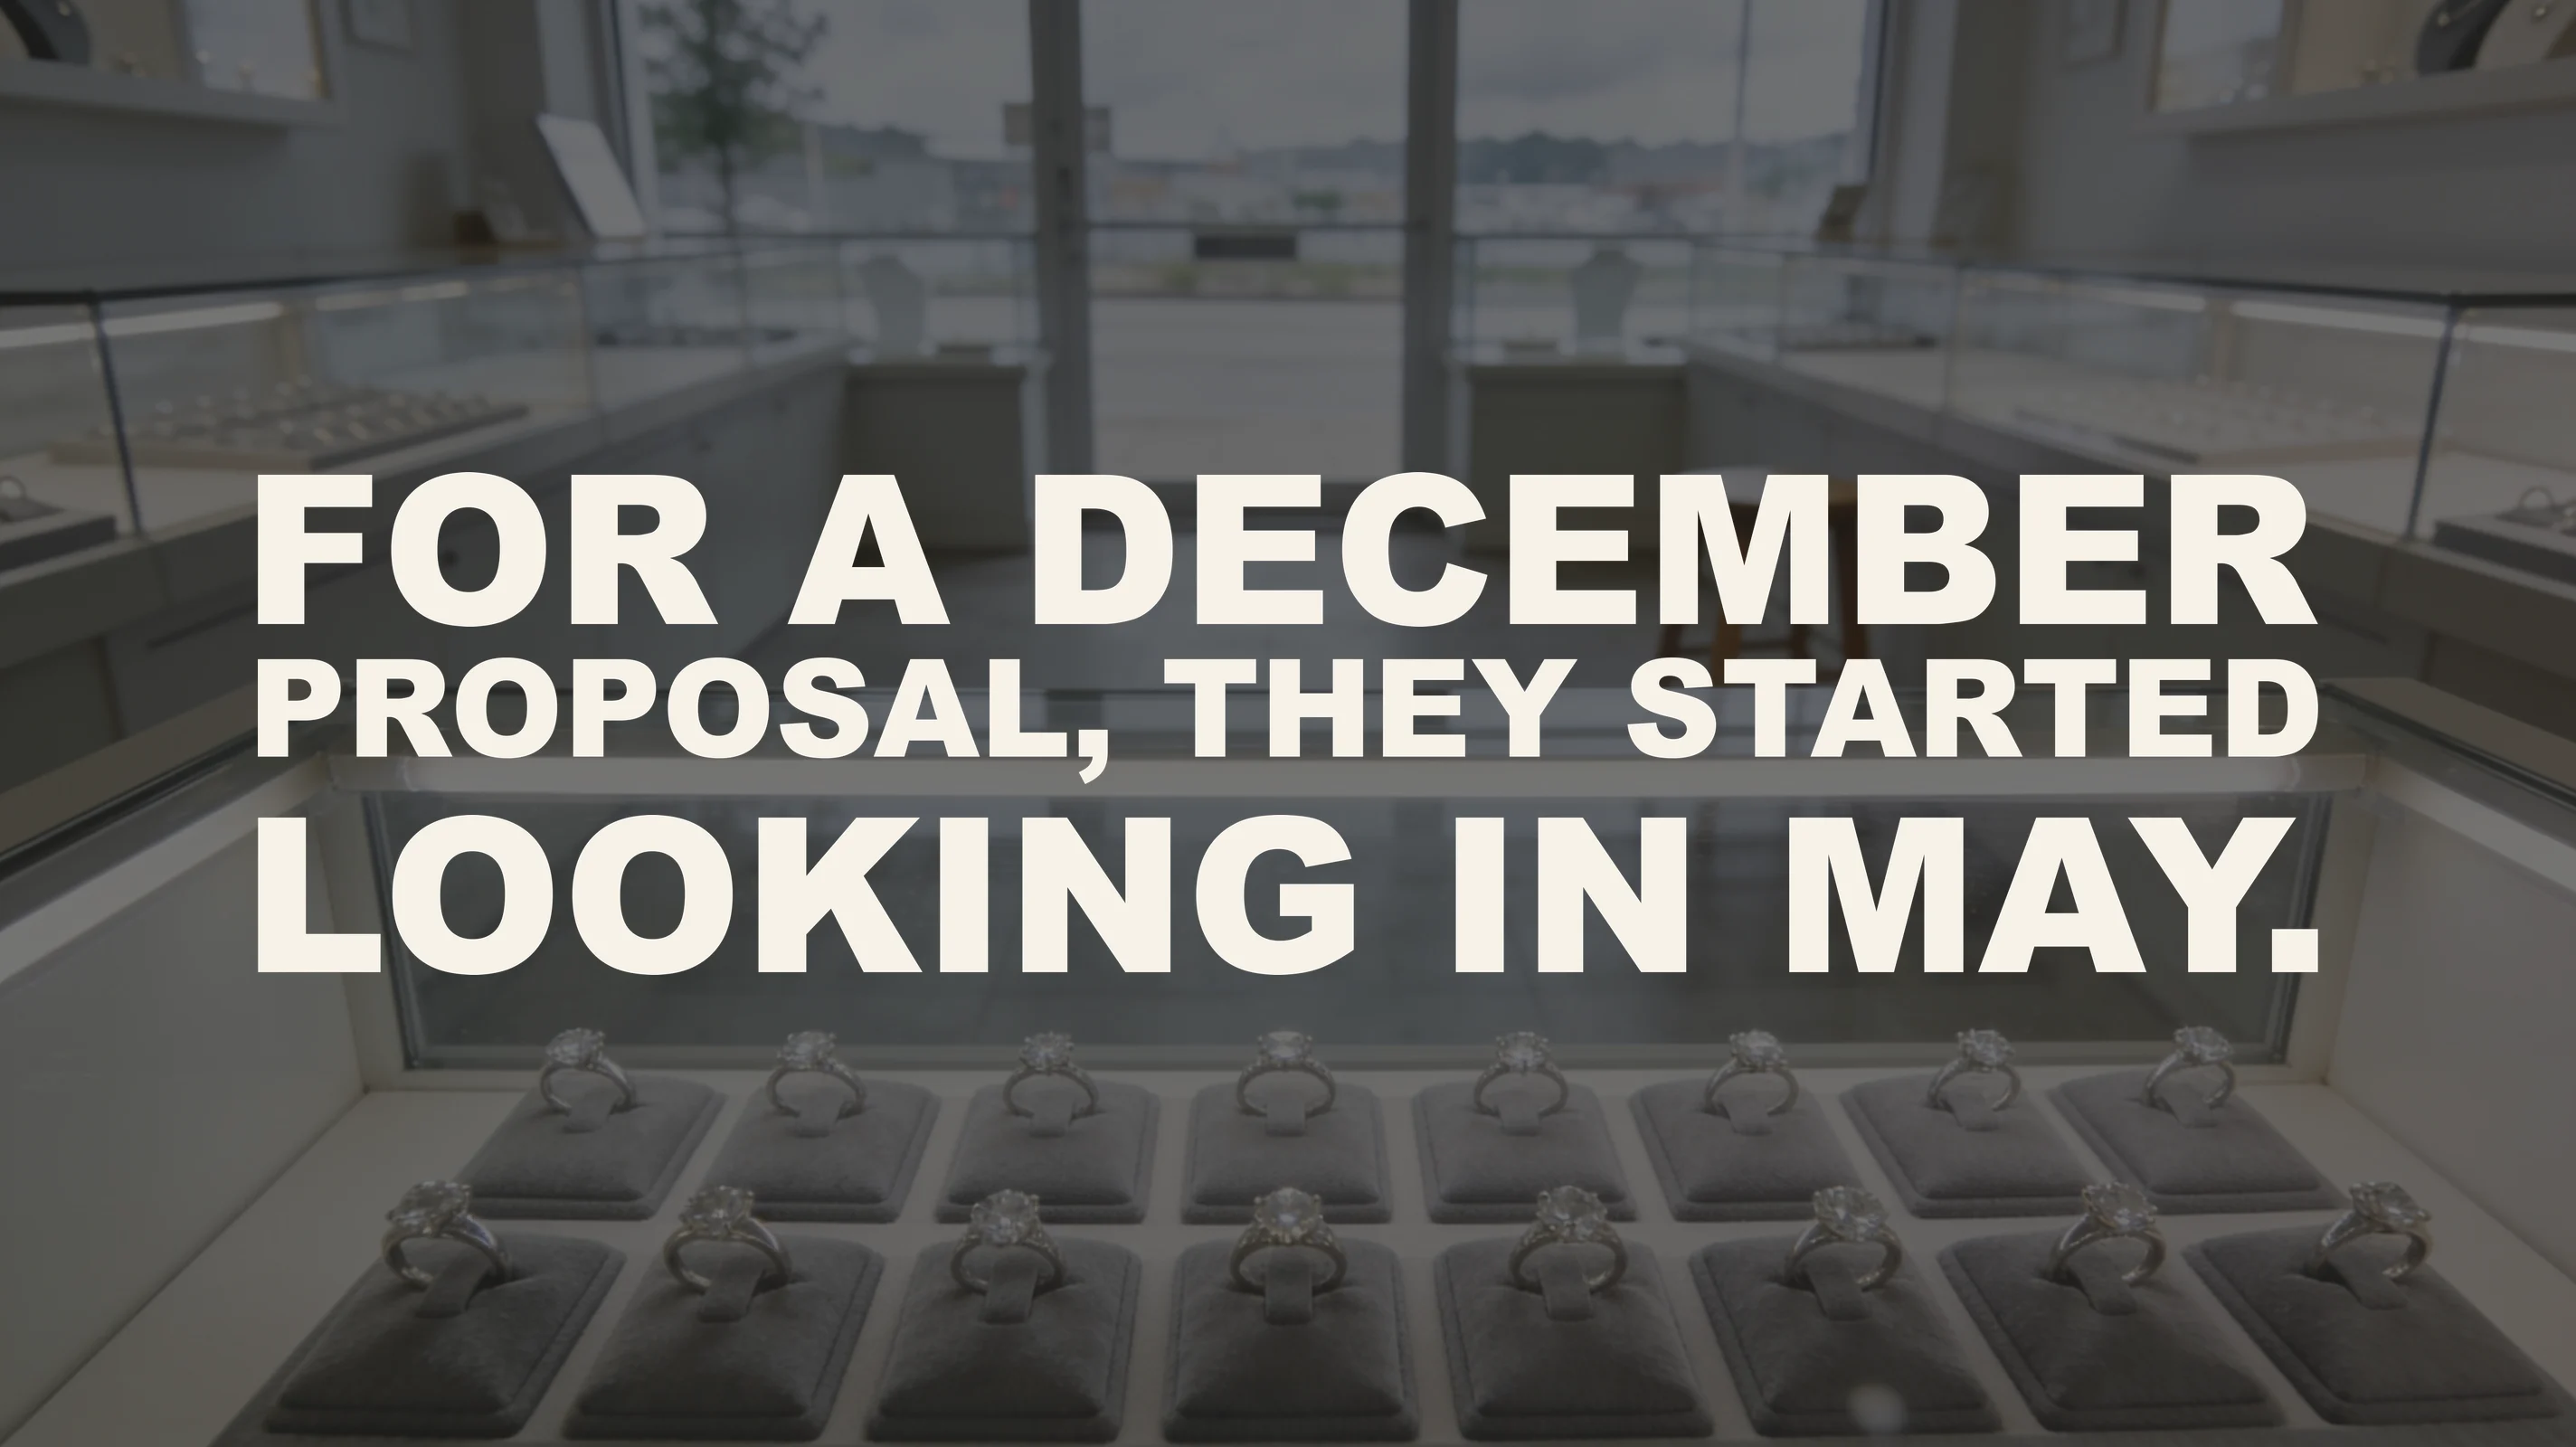
Bridal content should be live from 1 June for the following season: 57% of proposers begin researching more than six months before they propose.
Each figure below carries a label saying how much weight it can hold. [Measured] means a named study with a real sample stands behind it. [Survey — n=…] gives the sample size where the publisher discloses one. [Trade] means the trade press asserts it and nobody has measured it. [Stale] means it was real once and is too old to quote as current. [Not measured] means nobody has measured it and the industry repeats it anyway. Where a number is our own arithmetic on somebody else's published figure, it says so.
One of a series at myjewelrymarketing.com checking which parts of the advice given to independent jewelers anybody has measured; the wider picture is in the state of independent jewelry retail in 2026.
When should a jewelry store start marketing engagement rings?
About 1 June, for a season that peaks the following Christmas Eve. That is roughly 26 weeks of continuous bridal presence ahead of the November–February peak, and it is the single best-evidenced lead time in the jewelry calendar.
The number it rests on is this: 57% of proposers begin researching more than six months before the proposal. [Survey — n=10,474 US couples]
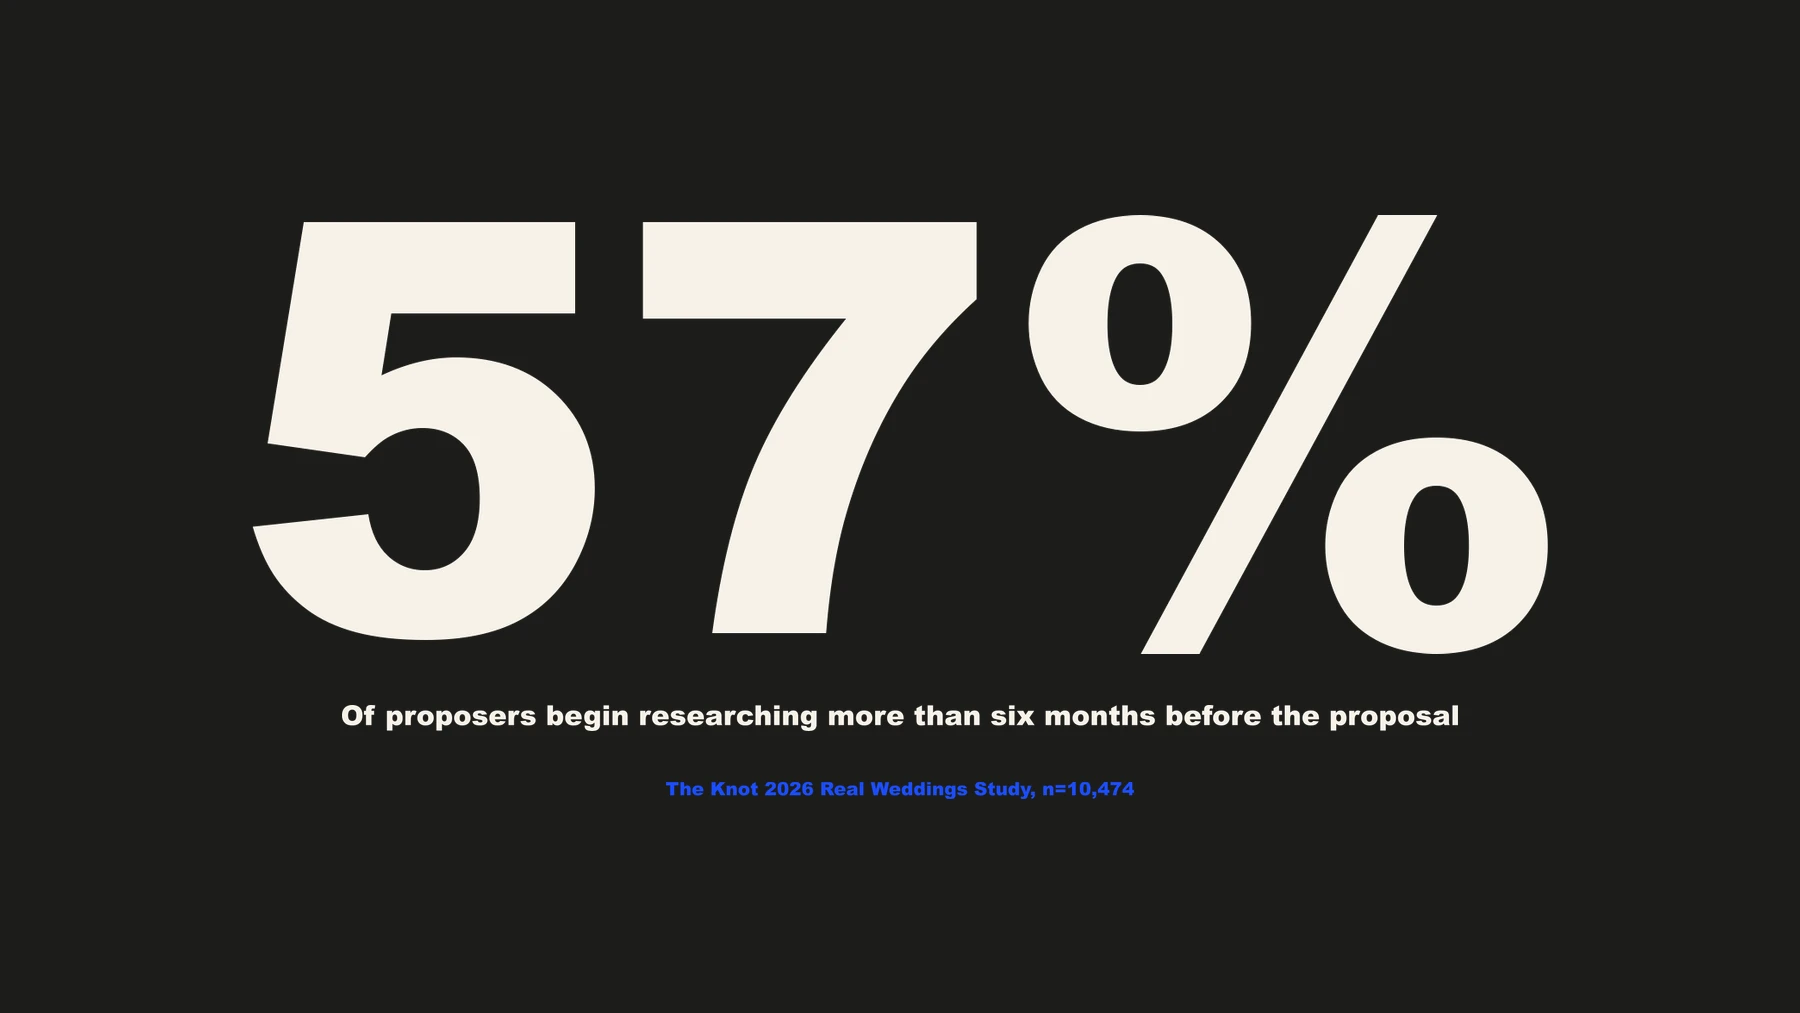
Read that against the peak and the arithmetic is uncomfortable. Christmas Day and Christmas Eve are the number one and number two proposal days of the year, followed by Valentine's Day. [Survey — n=10,474] Six months before Christmas Eve is 24 June. Six months before the season opens in mid-November is mid-May.
So the majority of the people who will propose this December were already looking at rings before this summer. A store that starts posting engagement rings in November is not early, and it is not even on time. It is arriving after most of that season's buyers have decided where they are going to look.
The "40% of proposals" figure everyone quotes was published in 2018
This is the part worth knowing before you plan anything around it.
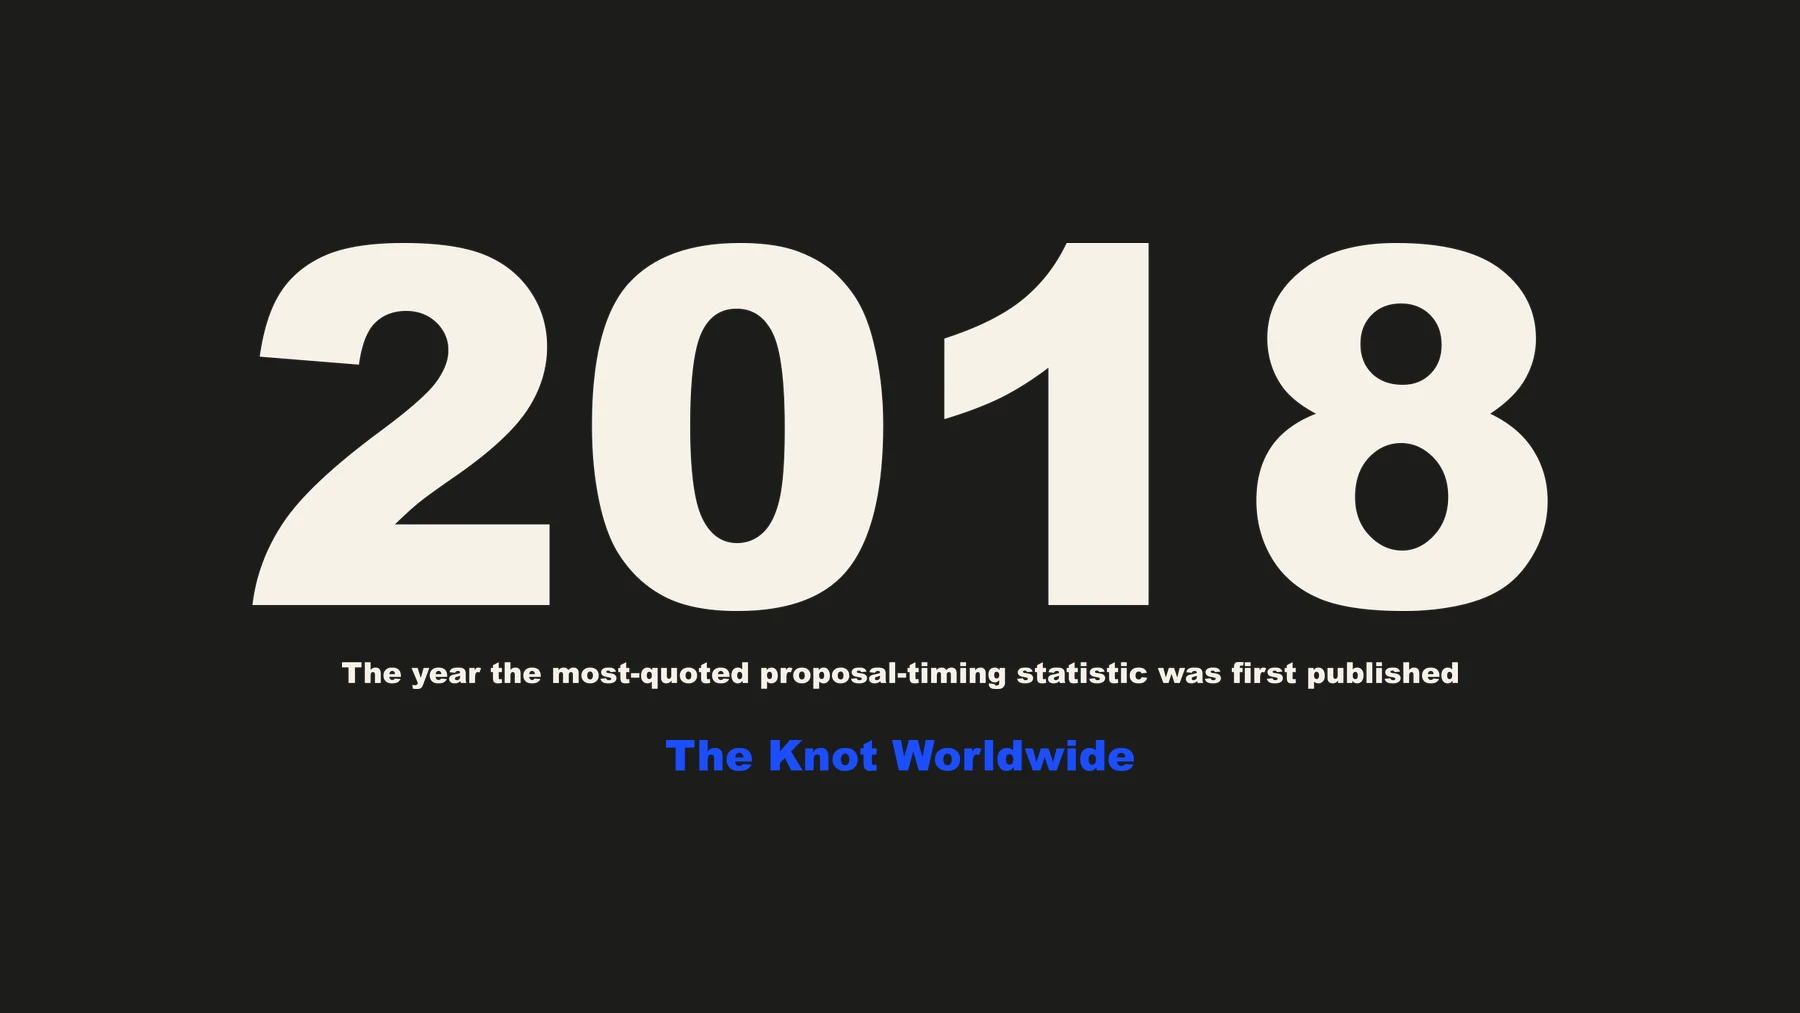
The statistic in circulation — nearly 40% of proposals happen between Thanksgiving and Valentine's Day — traces back to a 2018 Knot Worldwide press release. [Stale] It gets repeated in trade articles, vendor blog posts and marketing calendars without a date attached, which is how a figure from before the lab-grown market existed ends up underwriting a 2026 content plan.
The good news is that it did not need retiring, it needed restating, and it has been. The Knot's 2026 Real Weddings Study, of 10,474 US couples married in 2025, puts the same window at 40% of proposals. [Survey — n=10,474] That is a current measurement with a published sample, and it is the one to cite. The 2018 original is not wrong so much as unverifiable at this distance — and quoting an eight-year-old press release when a current study says the same thing is the exact habit this blog exists to point at.
47% and 40% are not the same statistic, and they are not a range
You will also see 47% quoted for engagement season, usually alongside the 40% as though the truth sits somewhere between them. It does not. They are two organisations measuring two different windows, and reading them as one range is the same error as reading two datasets as one trend.
- 47% of couples got engaged during engagement season, defined as November to February. Source: Tenoris, via INSTORE. That is a 17-week window. [Measured]
- 40% of proposals fall between Thanksgiving and Valentine's Day. Source: The Knot's 2026 study. That is about a 12-week window. [Survey — n=10,474]
The shorter window holds the smaller share. That is not a contradiction — it is what you would expect, and it means the two findings agree rather than compete.
What it also means is that the concentration is tighter than the four-month figure suggests. Twelve weeks is 23% of the year and carries 40% of the year's engagements: about 1.7 times the rate you would see if proposals were spread evenly. The seventeen-week window runs at about 1.4 times even. [Our arithmetic, computed separately within each study — the two are not combined, because they are different samples with different definitions.]
The practical consequence is a merchandising one rather than a marketing one. If you are deciding when the bridal case has to be full and staffed, the twelve-week number is the one to plan against, and Thanksgiving is the hard edge.
Engagement season is always-on, not a campaign
This is the distinction that decides whether a bridal calendar works, and almost every scheduling tool gets it wrong by design.
Most seasonal marketing is a campaign: a real ramp exists, so you pick the date and count backwards. Valentine's Day works like that — six weeks of content, three weeks heavy, five days of countdown. Black Friday works like that.
Engagement season does not. It is an always-on moment: the consideration window is longer than the gap between moments, so buyers are entering in every single week of the year, and the proposal date they are working towards is different for every one of them. A date-offset schedule — start six weeks before the peak — misfires on a moment shaped like this, because there is no single date to offset from. The person proposing on Christmas Eve and the person proposing on 3 February are both researching in June.
In our own 2026 calendar research that is written as a hard rule: always-on segments must have a non-zero allocation in every week of the year, including the slow season. Bridal, education and self-purchase are the three. It is the one rule in that file that overrides the seasonal weighting rather than bending to it.
The test for your own page is simple. Look back at your last twelve months. If there are stretches of six or eight weeks with no bridal content at all, you did not run a light season — you were absent during the months when next season's buyers were choosing which two stores to visit.
What the buyer actually does in those six months
The six months are not passive. Here is what the same study measured them doing, and each of these should change what you post.
- The typical buyer visits two retailers and physically examines about ten rings before purchasing. [Survey — n=10,474]
- 64% of engagement ring purchases happen in person. [Survey — n=10,474]
- 79% of recipients participate in selecting the ring, and one in four couples shop together before the proposal. [Survey — n=10,474]
- 90% of 2025 engagement rings were customised or custom-designed. [Survey — n=10,474]
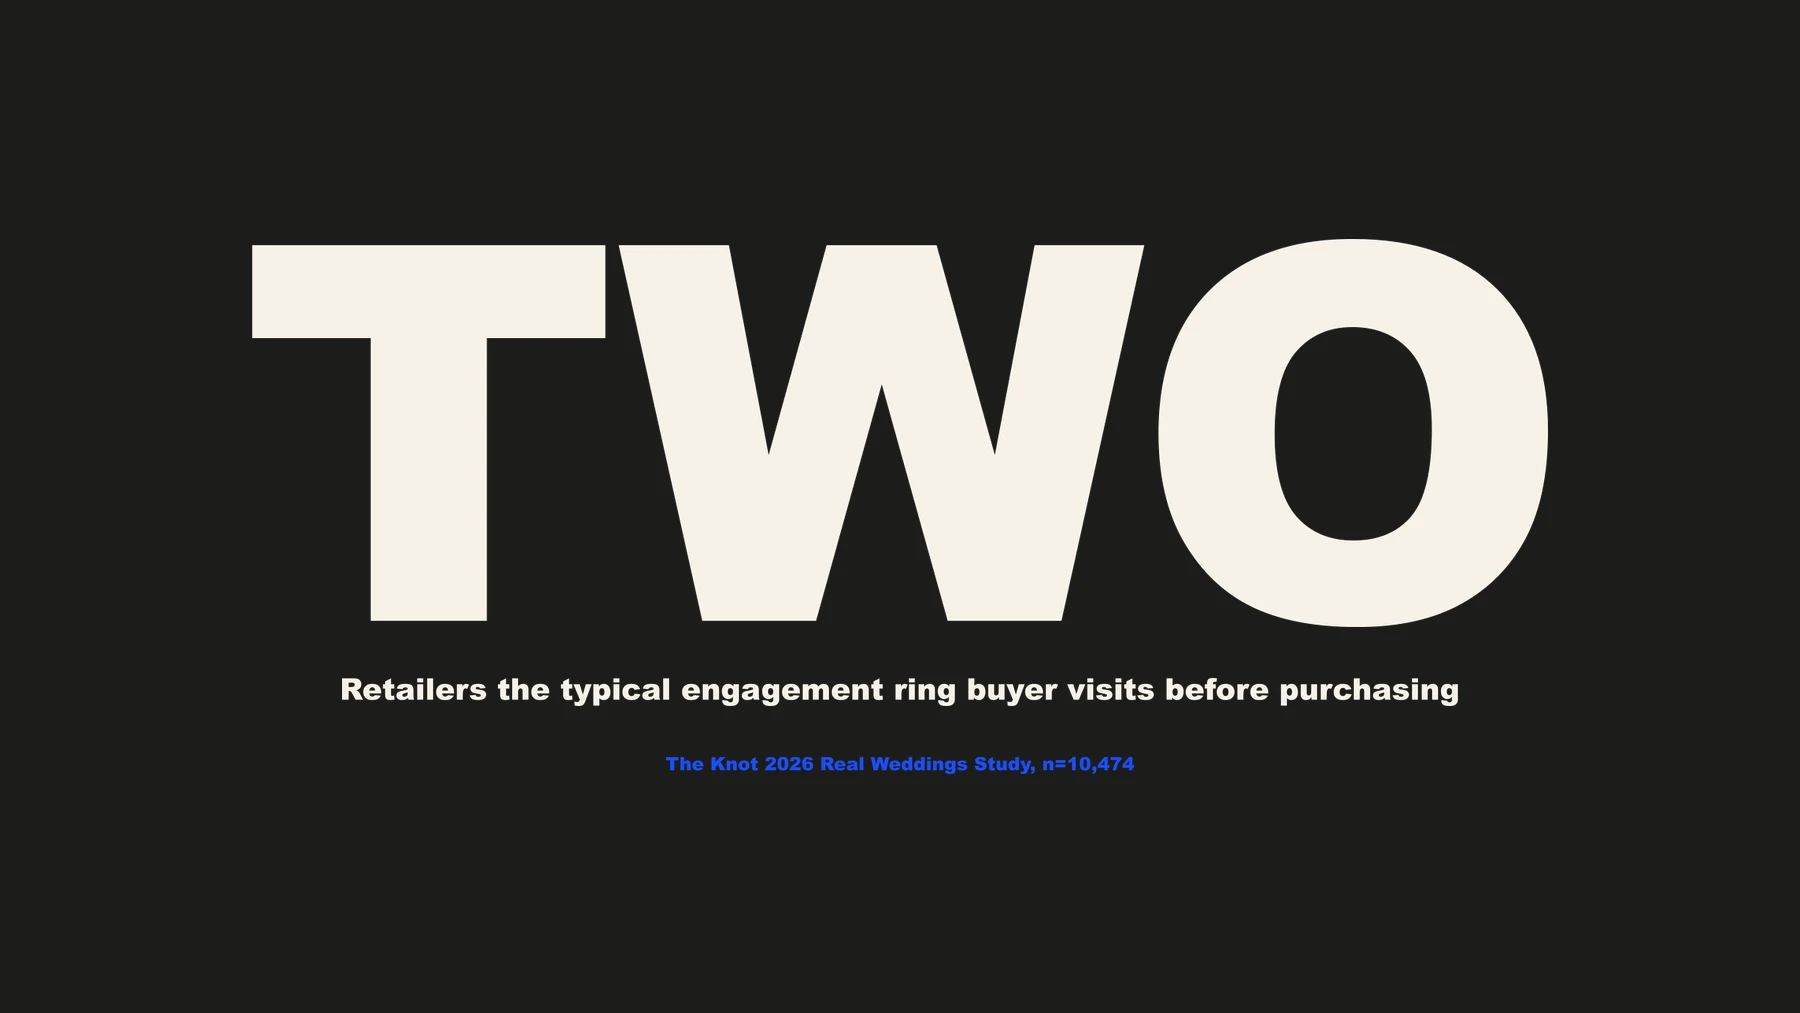
Two retailers is the number that should change your behaviour. It is not a consideration set you can join late by outspending somebody in November — it is two slots, filled over months, mostly before the buyer ever contacts anybody. The 26 weeks are not a branding exercise. They are how you become one of the two.
The 79% figure quietly retires a whole genre of bridal content. If four out of five recipients help choose the ring, then content built entirely around a secret — the hidden shopping trip, the total surprise — is addressed to a minority of your audience and speaks past the person most likely to be doing the research. It is usually two people looking now, together or in parallel. Write for both.
And the 90% is why process content outperforms product content here. When nearly every ring is customised, the thing a buyer is shopping for is not a piece in your case — it is confidence that you can make the one in their head. CAD screens, wax models, a stone being set, the same ring at four stages: that is the proof, and it is content a store which actually makes things can produce and a catalogue reseller cannot.
The 26 weeks, laid out
Dates are for the 2026–27 season. Shift them a year and they hold.
- 1 June — bridal goes live and stays live. Not a launch and not a campaign. A steady non-zero weekly allocation from here until the following February.
- June to August — process and education. The slow retail months are the cheap ones to build authority in, and they are when the December proposers are forming their shortlist. Custom process, stone education, what a setting costs and why.
- September and October — authority, not offers. This is the pre-season build window. December's consideration is seeded here; a product push now competes with nobody and converts nobody.
- Mid-November — the season opens. Cases full, staffed, and the bridal allocation goes heavy rather than starting.
- Thanksgiving to Christmas Eve — the dense twelve weeks. Christmas Eve and Christmas Day are the two biggest proposal days of the year, and this is the window the 40% figure describes.
- January and February — two moments, not a lull. The wedding band attach wave follows December's proposals, and there is a documented micro-moment in late January and early February for proposers who want to propose soon but not on a cliché holiday. [Trade]
- February onwards — bridal drops to its floor, and the floor is not zero. Next season's earliest researchers are already in the market.
Those windows are national. Which of them matters most for your store depends on who lives inside your trade area — the household ages and incomes within driving distance decide how much bridal demand is actually there, and it varies a great deal between towns. That analysis, built from your own postal codes and the published Census figures for them, is what myjewelrymarketing.com/demo/strategy produces for a single store.
If you are reading this in autumn, you have already missed the start
Worth saying plainly, because the alternative is pretending otherwise.
If it is September and your bridal content has not been running since June, the ideal start for this season is behind you. Nothing in the next eight weeks recovers 26 weeks of presence, and any advice that says otherwise is selling something.
What is still worth doing, in order:
- Start now anyway. The season's late deciders are real, the twelve-week window is dense, and eight weeks of presence beats two.
- Weight the January and February micro-moments. They are the least contested part of the season, they are downstream of proposals that have already happened, and the band attach wave needs no lead time you have missed. [Trade]
- Put 1 June in next year's diary as a hard date. Not "spring". The first of June.
- Build the library in the slow months. A store that spends June to August shooting custom process has a season's worth of content before the season starts. A store that starts in November is producing and posting at the same time, in its busiest quarter, which is exactly why the content stops.
The admission is more useful than the reassurance. A jeweler who understands why this December will be harder than it needed to be is a jeweler who starts on time next year.
What is not measured here
Three things, since the rest of this article leans on the honesty of its labels.
- The 26 weeks is inference, not a measurement. The input is measured — 57% research more than six months out, n=10,474. Converting that into a content lead time is our judgement about what being present during their research requires. No study has tested a 26-week bridal schedule against a shorter one. [Not measured]
- No published source measures bridal content performance on social media. There is no study of which bridal formats work for a jewelry store's page. What exists is measurement of buyer behaviour, which is what this article uses, plus the general format findings covered in why photo albums beat Reels for small jewelry pages. Anyone quoting a bridal-specific engagement benchmark is quoting something that does not exist. [Not measured]
- The January band-attach wave is trade-observed and its timing is not. That the wave happens is consistent trade reporting. When to start marketing into it has no measured lead time, and we have not invented one. [Trade]
The short version
For a December proposal, most buyers started looking in May or June: 57% of proposers begin researching more than six months out, so bridal content needs to be live from about 1 June and stay live — 26 weeks of continuous presence, which is the best-evidenced lead time in the jewelry calendar. The two share figures in circulation are not a range: Tenoris measures 47% of engagements across a seventeen-week November-to-February window, The Knot measures 40% across the twelve weeks from Thanksgiving to Valentine's Day, and the older "nearly 40%" version everyone quotes was published in 2018 and has since been restated by a current study of 10,474 couples. Engagement season is an always-on moment rather than a campaign, so a date-offset schedule misfires on it — buyers enter in every week of the year. In those six months the typical buyer visits just two stores and examines about ten rings, 79% of recipients help choose, and 90% of rings are customised, which is why process content beats product content and why arriving in November means arriving after the shortlist was written. If it is already autumn, start anyway, weight January and February, and put 1 June in the diary.
Get this for your own store
How much bridal demand actually sits in your trade area is a question about who lives there — the age profile and household incomes within driving distance, which decide how many proposals a year your catchment realistically produces. That analysis, along with a Facebook plan built on the research in this article, is free at myjewelrymarketing.com/demo/strategy. Paste your website address and read it in a couple of minutes.
Sources
Compiled by My Jewelry Marketing — myjewelrymarketing.com.
- Proposal timing, research lead time and buyer behaviour. The Knot Worldwide 2026 Real Weddings Study — 10,474 US couples married in 2025, published 18 February 2026 — reported via INSTORE Magazine, "What 10,000 Couples Who Just Got Married Can Tell You About Your Business", 24 February 2026, and via Rapaport, 19 February 2026. Source of the 57%, the 40%, the two-retailers and ten-rings figures, the 64% in-person, the 79% participation and the 90% customised. The study index is published at The Knot.
- The 2018 original. The "nearly 40% of proposals between Thanksgiving and Valentine's Day" figure in general circulation traces to a Knot Worldwide press release of 2018. Cite the 2026 restatement above, not the original.
- The 47% engagement-season share. Tenoris point-of-sale data, reported via INSTORE Magazine, 12 February 2026. A November-to-February window, and a different measurement from The Knot's.
- The late-January micro-moment. INSTORE, "Weekly Dates and To-Dos: Jan 5–11", 4 January 2026. Trade guidance, not measured consumer data.
- Engagement ring trends and customisation. National Jeweler, "Engagement Ring Trends 2026: What's In, and Why", 5 March 2026.
- Seasonal concentration and the December run. Edge Retail Academy, "December 2025 Jewelry Retailer Statistics", 2 January 2026 — point-of-sale data from approximately 2,000 US independents.
- Format performance referenced in passing. Socialinsider's Facebook benchmarks, 2026 — 130,683 Facebook pages and 25 million posts.
- The always-on rule and the 26-week lead time. My Jewelry Marketing's own 2026 calendar research, which classifies every seasonal moment as always-on, campaign or trigger and states the lead-time confidence on each. The 26 weeks is recorded there as inference from a measured input, and is labelled that way above.