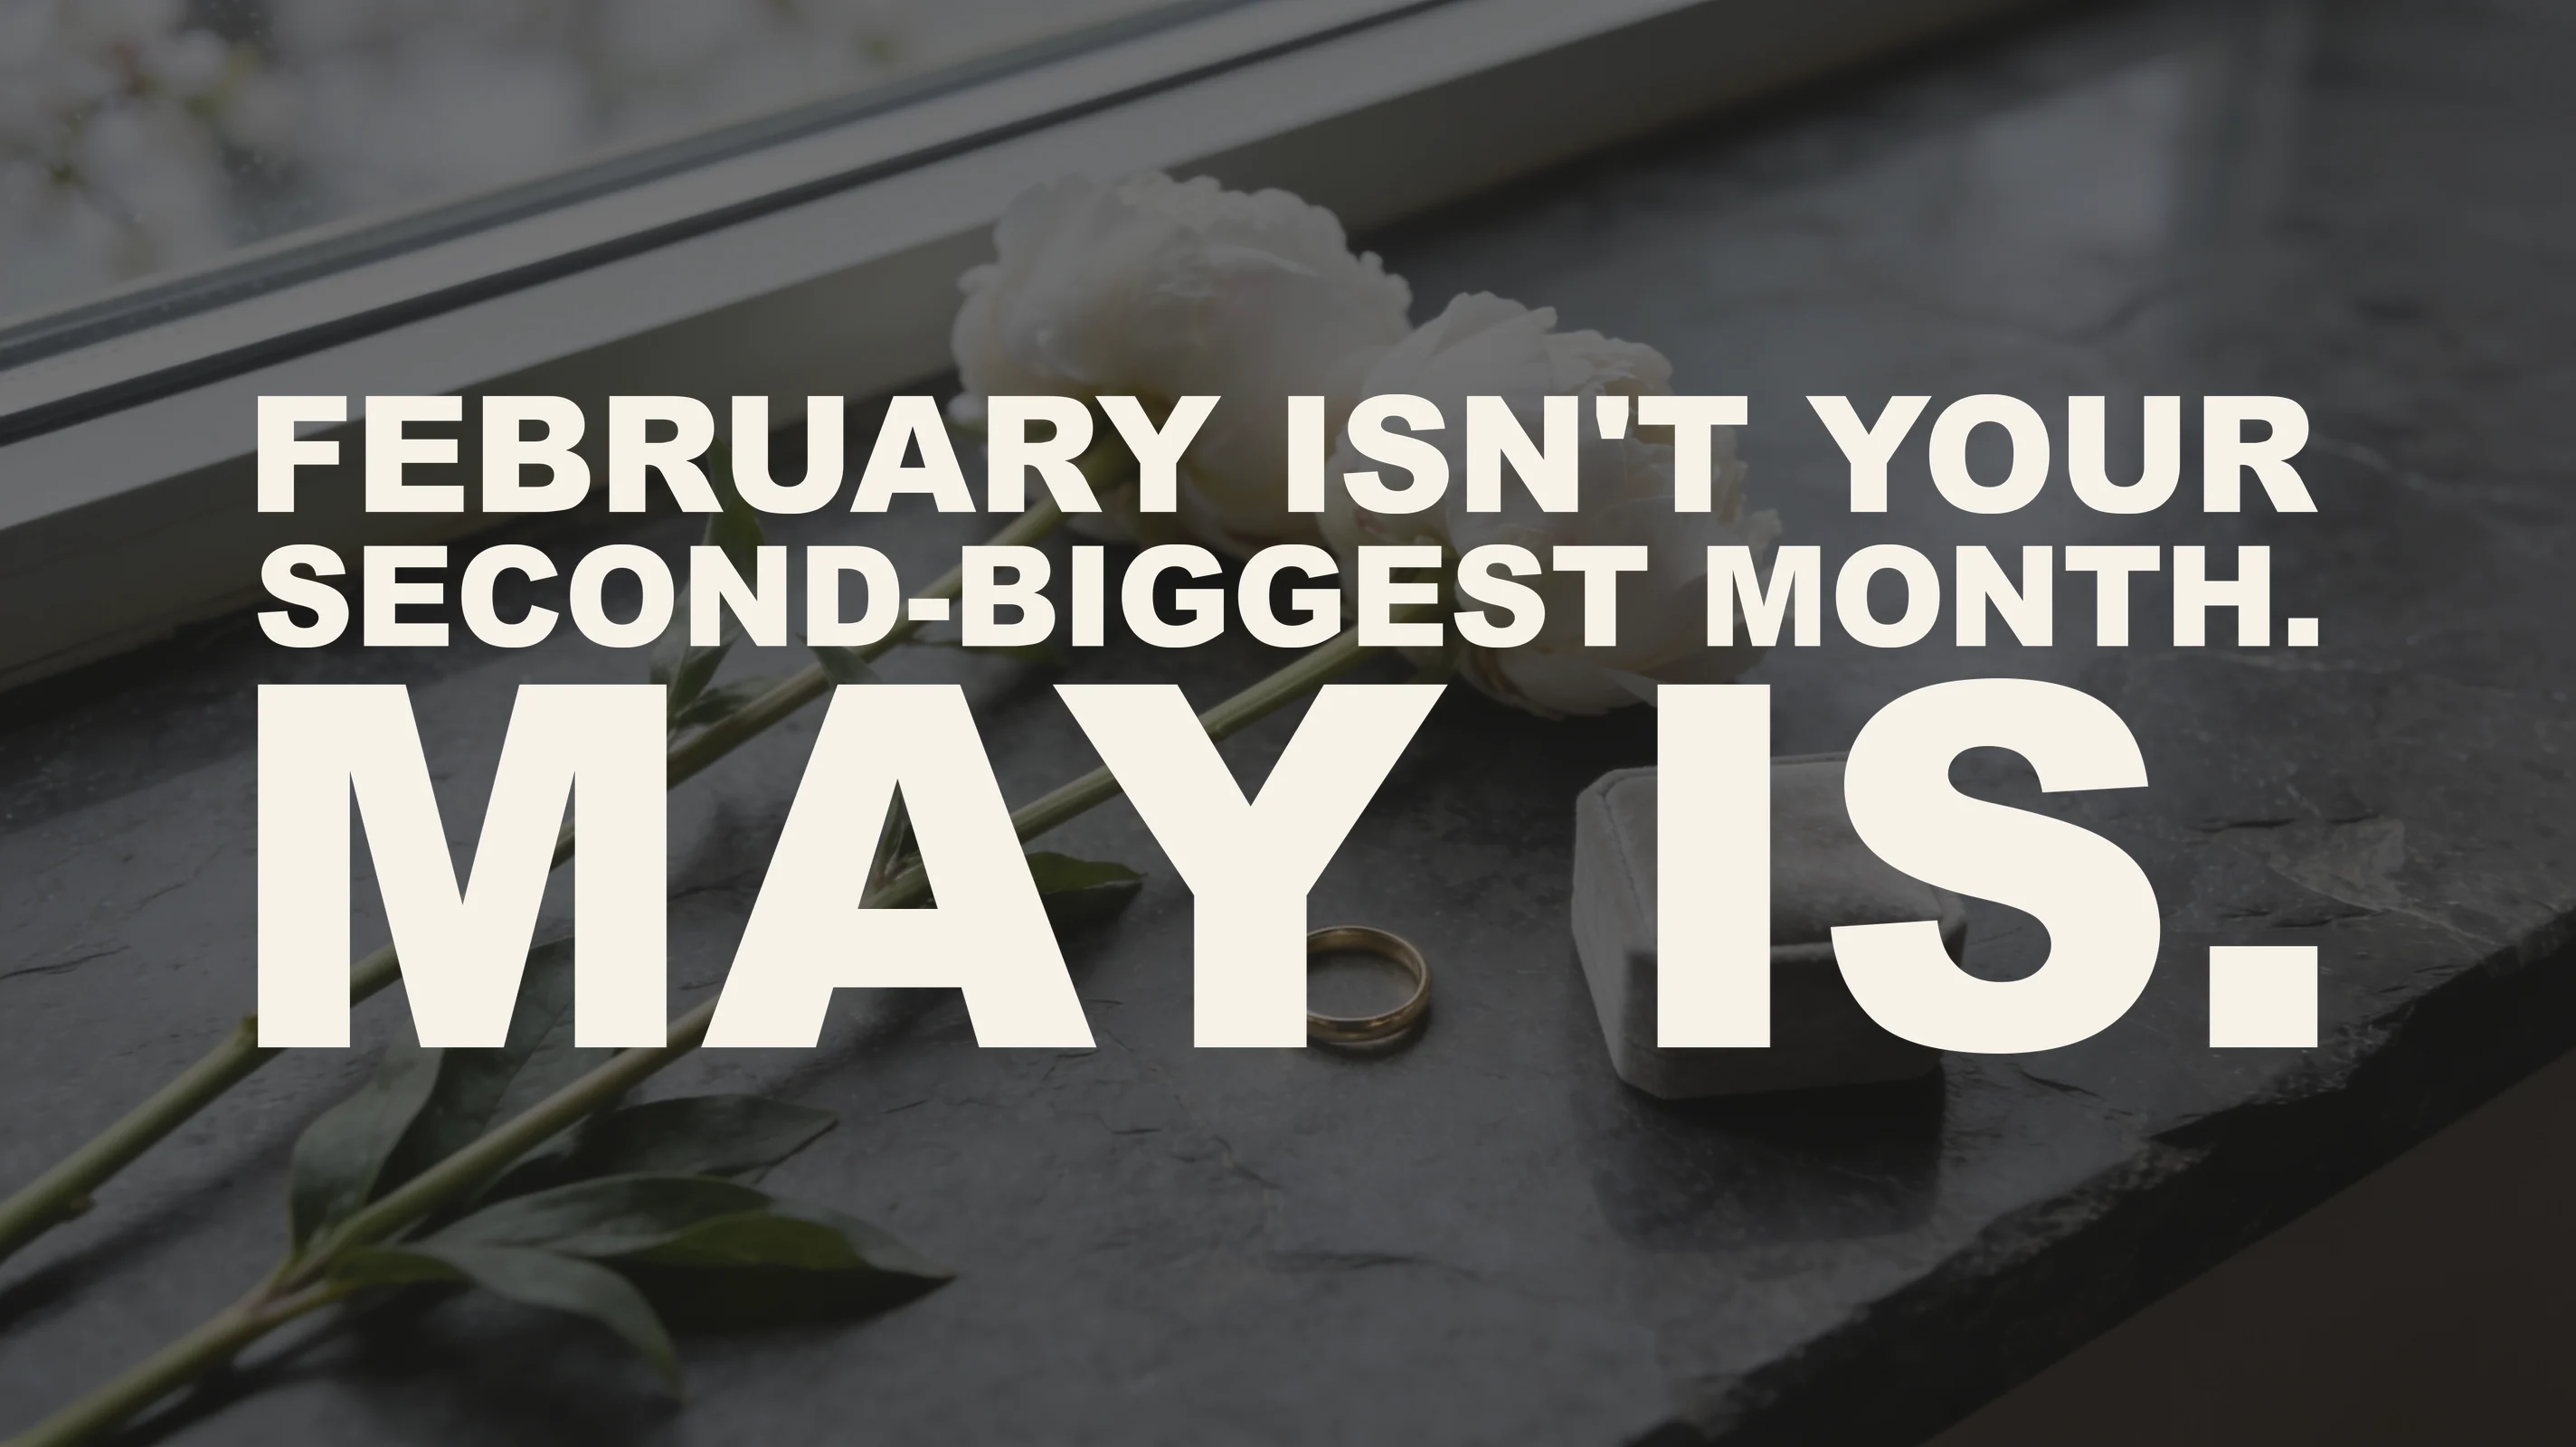
December is 18–19% of a US jewelry store's year, and the second-biggest month is May at 107% of an average month — not February, which indexes at 92.
Each figure below carries a label saying how much weight it can hold. [Measured] means a named study or an official series stands behind it. [Survey] means a survey. [Trade] means consistent trade reporting without a published measurement. [Not measured] means the industry repeats it and nobody has measured it.
One of a series at myjewelrymarketing.com checking which parts of the advice given to independent jewelers anybody has measured; the wider picture is in the state of independent jewelry retail in 2026.
Where these figures come from, and their one limitation
Every index number in this article comes from the US Census Bureau's monthly retail series for jewelry stores — the only official month-by-month measurement of the category that has ever existed. [Measured] An index of 100 means an average month of US jewelry-store sales; 227 means more than twice an average month.
The limitation, stated plainly because nobody else who quotes this data states it: the Census stopped breaking out jewelry stores in February 2021, when the industry classification system was revised. There is no current official month-by-month series, so the shape below rests on 2019 — the last full pre-revision year — as a structural baseline. It describes the shape of the jewelry year, not a forecast of next year's dollars. If a vendor quotes you a current-year monthly figure for US jewelry-store sales, ask them where it came from, because the government has not published one in five years.
The real shape of the year, month by month
The full calendar, with each month's index against an average month of 100. [Measured — 2019 structural baseline]
- January — 66. The weakest month of the year, a 71% collapse from December. Do not go dark: December is the most popular month to propose, so January's quiet is full of just-engaged couples who need wedding bands, sizing, appraisals and insurance updates.
- February — 92. Valentine's Day — and still below an average month. Content from mid-January; last-minute push February 10–13.
- March — 81. Quiet. The right month for education, styling and low-pressure brand building.
- April — 88. Diamond education, Easter, and the Mother's Day teaser from mid-month.
- May — 107. The second-biggest month of the year. Mother's Day, graduation and the opening of wedding season converge.
- June — 84. Peak wedding month: anniversary bands, pearls, men's jewelry, wedding-party gifts.
- July — 88. Trunk shows and summer styling — and the right time to sell custom, because a piece sold in July delivers comfortably by the holidays.
- August — 92. Back-to-school; lower jewelry relevance. Build content inventory for the quarter ahead.
- September — 86. The real Q4 starting line: custom orders that must be delivered by December have to be sold now.
- October — 86. Holiday preview, wish lists, layaway, appointment booking. Fall engagements begin.
- November — 103. Black Friday, Cyber Monday, and the strongest local hook of the year: Small Business Saturday.
- December — 227. 18–19% of the entire year, and the single most popular month to propose. Post daily; shift to "in-store pickup, still time" around the 15th.
Two corrections fall straight out of that table, and both contradict widely repeated advice.
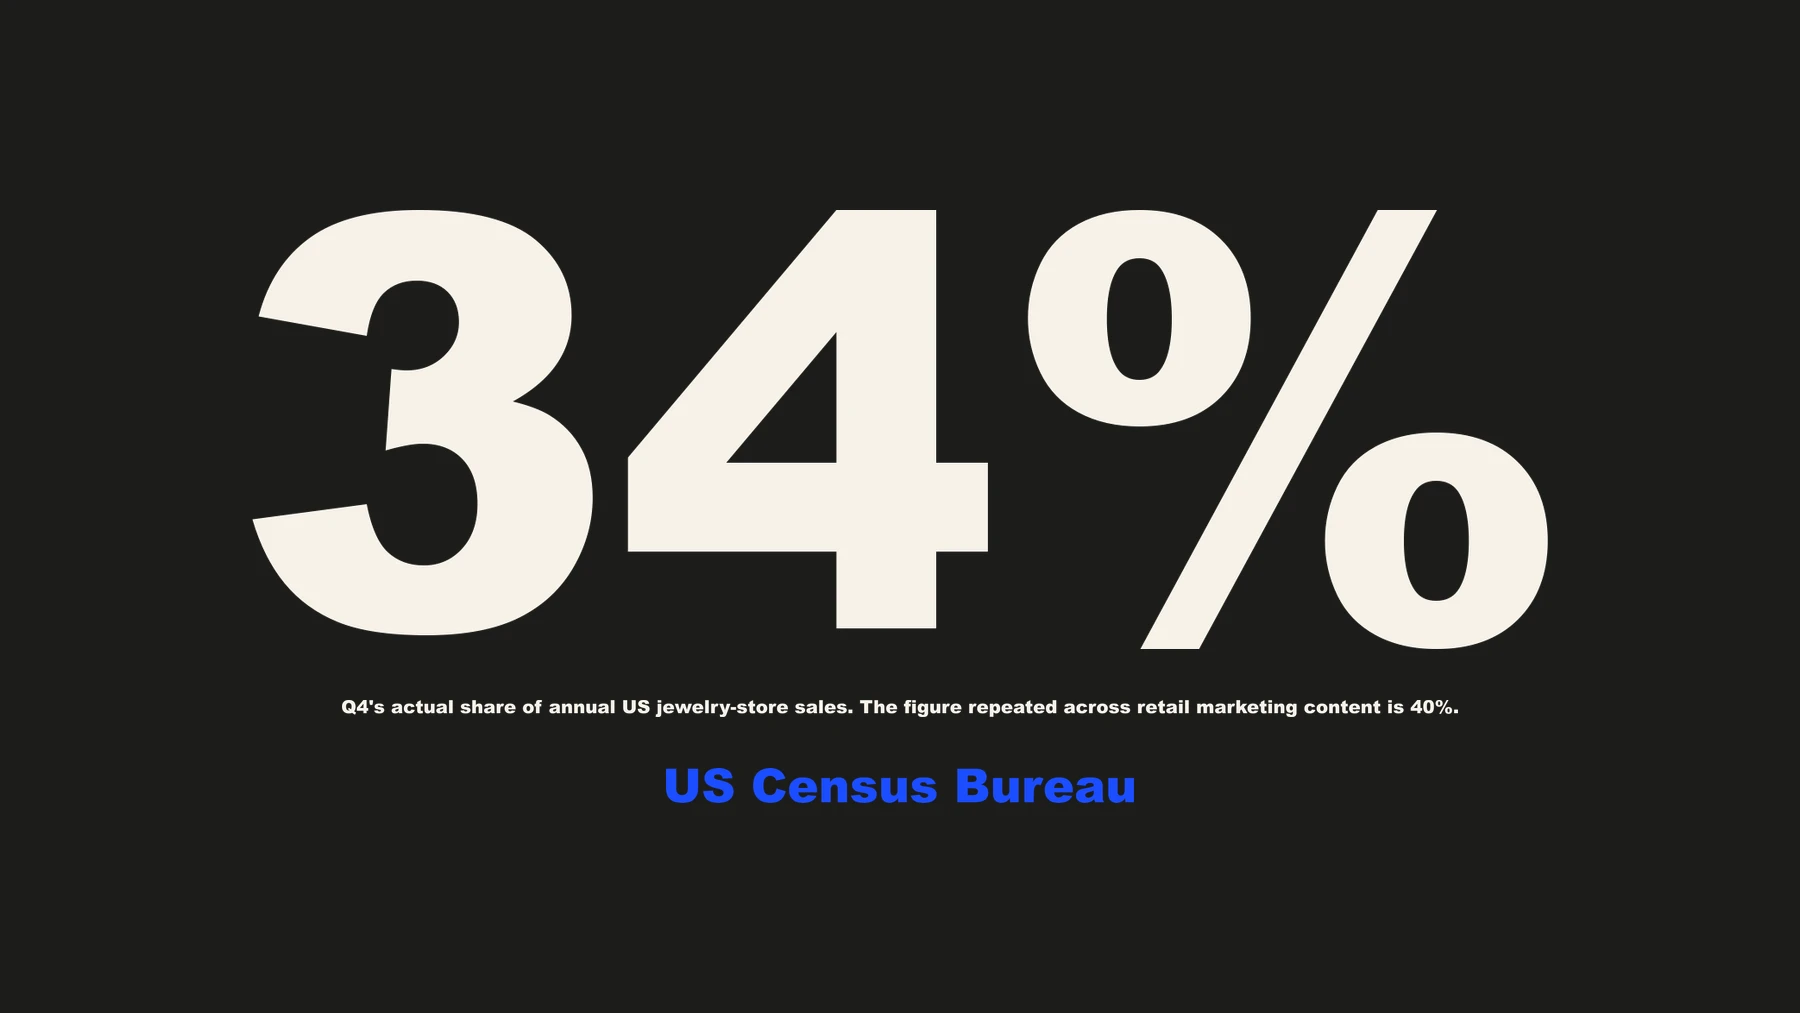
Q4 is about 34% of annual sales, not the 40% repeated across retail marketing content. [Measured — 2019 baseline] Six points sounds small until it is budget: a store planning against the 40% figure over-concentrates its spend and attention in a quarter that is already the easiest to get right, and takes it from the months below that nobody competes for. The 40% claim is one of fourteen we traced in Fourteen Facebook statistics, traced; it did not survive.
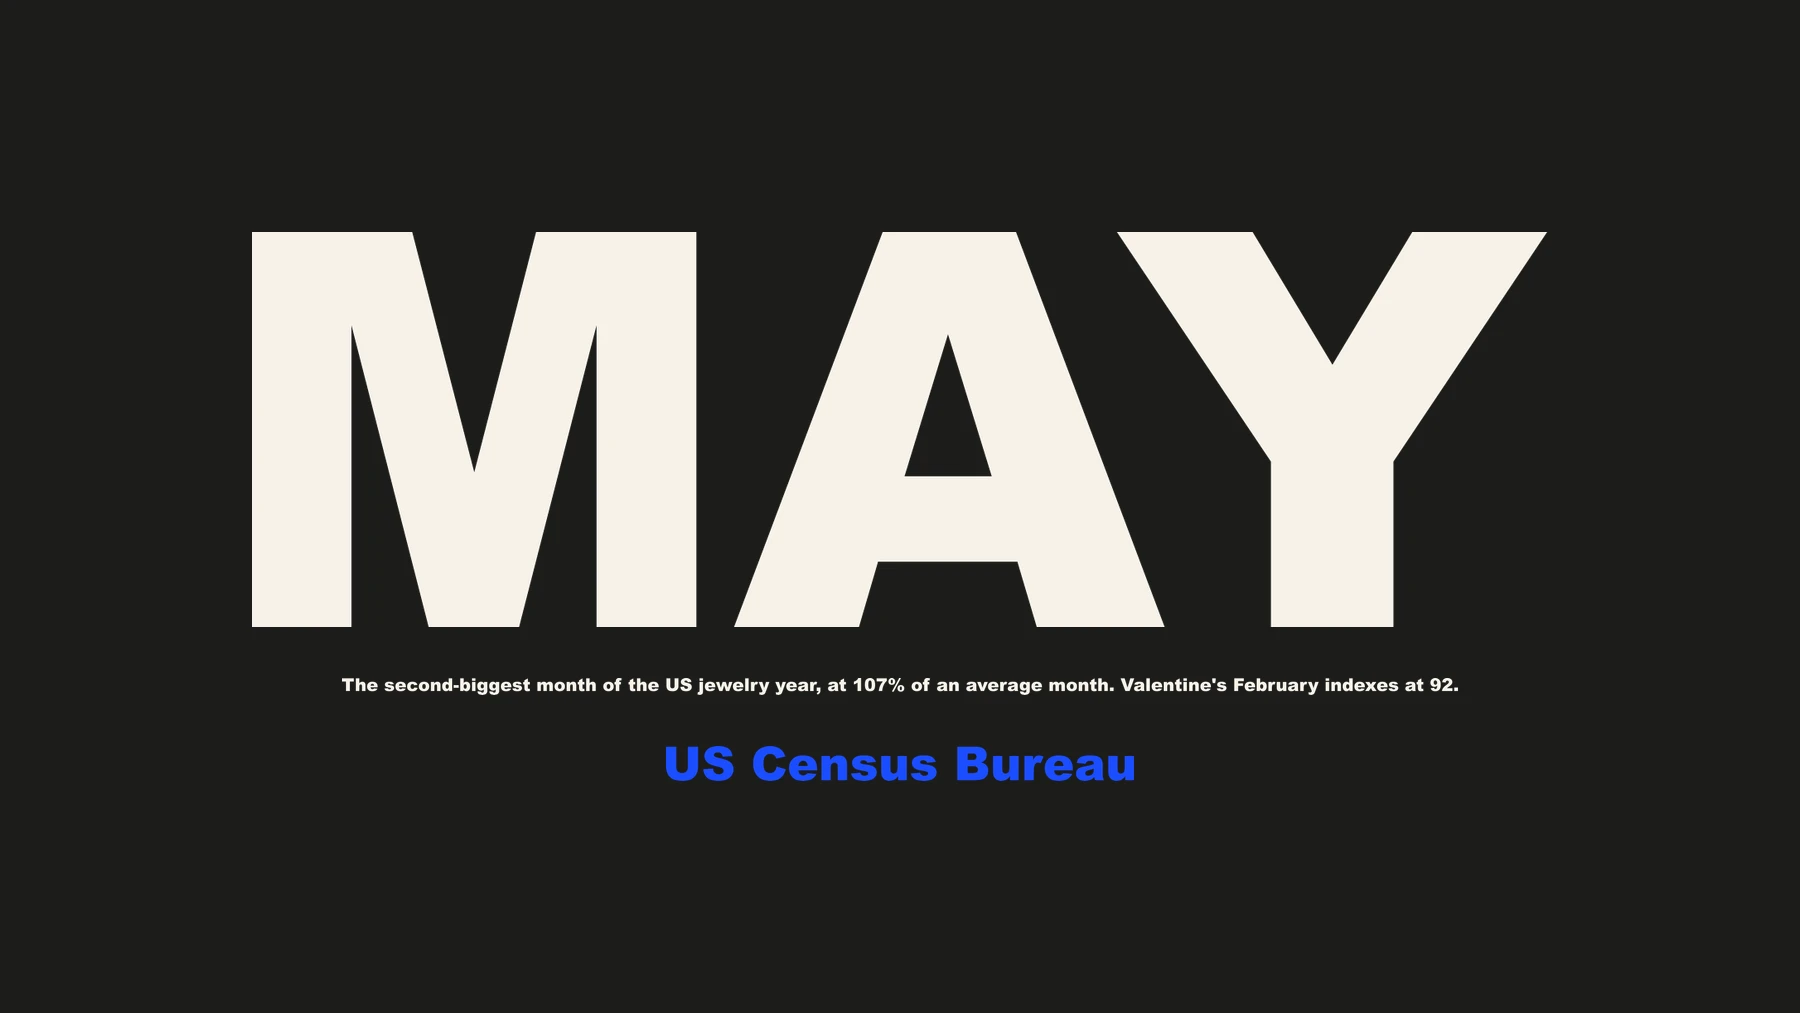
And February is not your second-biggest month. Valentine's February indexes at 92 — below an average month, and tied with August, a month with no jewelry occasion at all. May indexes at 107. If your marketing calendar has two big pushes a year and they are December and February, you are skipping your actual second season to fight hardest in a month that sells like back-to-school.
May is the under-marketed peak, and the reason is structural
May is the year's second-biggest month because three occasions converge — Mother's Day, graduation, and the opening of wedding season — and it is the most under-marketed because none of the three belongs to jewelry the way Valentine's Day does. [Measured — 2019 baseline] Every gift category fights for February; far fewer plan seriously for May.
The practical consequence is lead time. Mother's Day content starts in mid-April, with the peak selling window running roughly April 21 to May 8; graduation content from late April. [Trade] A store that treats May as an ordinary month decides all of this by not deciding it in April.
The lead times matter more than the peaks
Knowing December is enormous is worthless — everyone knows. What the calendar actually decides is when work starts, and the start dates sit weeks to months ahead of the moments they serve:
- Custom for Christmas is sold in July, August and September, because the bench time runs out long before the gifting deadline does. September 1 is the operative starting line for Q4 messaging, not November 1. [Trade]
- Holiday content is live by mid-October — September and October are when December's buyers are researching, which makes them education-and-authority months rather than product-push months. [Trade]
- Engagement-season content starts around June 1, because 57% of proposers begin researching more than six months out. [Survey — n=10,474] The full 26-week argument is in for a December proposal, they started looking in May.
- January is a working month, not a dead one. The index says 66; the proposals of the year's most popular proposal month say the store should be talking to just-engaged couples from January 1. A repair push also lands well here — post-holiday breakage arrives on its own schedule.
If you are reading this in late September or October: the Q4 starting line has just passed, and the right response is to start now rather than write the quarter off — and to put June 1 and April 14 in next year's diary, because those are the two dates this article exists to move.
On ad costs: expect them to climb into Black Friday and fall back in January — the direction is consistent across ad-platform reporting, but no jewelry-specific measurement of the size of that swing exists, so we are not quoting one. [Not measured]
What this article does not tell you
- These are national figures. Your trade area may skew the shape — a college town moves graduation; a resort town moves summer. The structure is the starting point, not the answer.
- The index measures sales, not marketing response. No study measures what a marketing dollar returns by month in this category. The inference that under-marketed months are cheaper to compete in is reasoning, not measurement. [Not measured]
- The series is frozen at 2019's shape. Lab-grown pricing, the repair boom and post-2021 inflation have all shifted the category since. The peaks' order is unlikely to have changed; the decimal places should not be leaned on.
Which of these months matter most for your own store depends on who lives within driving distance — the trade-area calendar inside the free strategy at myjewelrymarketing.com/demo/strategy maps this national shape onto your own postal codes and their Census demographics.
What does this mean for the independent jeweler?
It means the calendar most stores work from is weighted the wrong way: too much effort goes into February, not enough into May, and nearly all of it starts too late. A store with two or three people on the floor usually plans the next occasion when it is already on top of them, and on this calendar that is always weeks after the work should have started. Custom for Christmas is sold in July, August and September; holiday content needs to be live by mid-October; engagement content should start around June 1. By the time December feels close, most of what decides it is already done.
It also means you should be sceptical of any plan built on the 40% Q4 figure, or on February as the second peak. Neither holds up against the only official monthly series there is, and a budget built on them moves money out of the months where you would face the least competition.
What's the solution?
Put the start dates in the diary, not the peaks. Five dates do most of the work:
- Mid-April: start Mother's Day. Content goes live around April 14, ahead of the April 21 to May 8 selling window, with graduation from late April.
- June 1: start engagement content. Proposers begin researching months ahead, so December's proposals are being researched in summer.
- July: start selling custom for Christmas. Say it plainly in the case and on the page: a piece ordered now delivers comfortably by the holidays.
- September 1: start Q4. Education and authority first, since this is when December's buyers are doing their research. Product pushes come later.
- January 1: talk to the newly engaged. Wedding bands, sizing, appraisals, insurance updates, and post-holiday repairs, in the year's quietest month.
Then treat February as an ordinary good month rather than a second Christmas, and spend what that frees up on May.
This is how My Jewelry Marketing plans a store's year. Each month's work is set by what has to start that month, not by what happens in it, and the months are weighted by the store's own trade area rather than the national average. Then we make the posts and put them up, so the April start actually happens in April.
The short version
US Census data gives the jewelry year one peak everyone plans for and one almost nobody does. December is 18–19% of annual sales and the most popular month to propose; May — Mother's Day, graduation and the opening of wedding season — is the second-biggest month at 107% of average, while Valentine's February sits at 92, below an average month and tied with August. Q4 is about 34% of the year, not the 40% in circulation. The dates that matter are lead times, not peaks: engagement content from June 1, custom-for-Christmas selling from July, Q4 messaging from September 1, holiday content by mid-October, Mother's Day from mid-April — and January, the smallest month, is when the year's biggest crop of newly engaged couples walks in.
Get this for your own store
The calendar above is national, and your store is not. The same analysis built from your own postal codes — which of these months your trade area actually over- or under-indexes, and a Facebook plan sequenced to those lead times — is free at myjewelrymarketing.com/demo/strategy. Paste your website address and read it in a couple of minutes.
Sources
Compiled by My Jewelry Marketing — myjewelrymarketing.com.
- The monthly index, the 34% Q4 share, and the 18–19% December share. US Census Bureau, Retail Sales: Jewelry Stores (MRTSSM44831USN), via FRED — monthly series, January 1992 to February 2021, not seasonally adjusted; 2019 used as the structural baseline since the series ended with the NAICS revision. Index arithmetic is ours: each month's 2019 sales against the 2019 monthly average.
- Proposal research lead times. The Knot 2026 Real Weddings Study, n=10,474 US couples married in 2025 — 57% of proposers begin researching more than six months out; December the most popular month to propose. Reported via Rapaport, 19 February 2026.
- Month-by-month focus and start dates. Trade practice compiled from INSTORE, National Jeweler and American Gem Society seasonal guidance, labelled [Trade] above because it is consistent reporting rather than measurement.
- Ad-cost seasonality. Direction only; no jewelry-specific measurement of the Q4 swing exists, and none is quoted here.