There is no current jewelry-specific benchmark for marketing spend. The 4.2% figure the trade quotes was reported in 2008; for an established store, 5% to 8% of revenue is the defensible range.
This is the most-asked question in independent jewelry retail and it has the worst available answer. Both halves of that are worth being straight about, because the usual approach is to quote a number confidently and hope nobody follows it back.
As everywhere on this blog, each figure below carries a label saying how much weight it can hold. [Measured] means a named study with a real sample stands behind it. [Survey] means a survey. [Stale] means it was real once and is too old to quote as current. [Not measured] means nobody has ever measured it. Where no reliable source exists, this says so rather than filling the gap.
One of a series at myjewelrymarketing.com checking which parts of the advice given to independent jewelers anybody has measured.
The number everyone quotes is from 2008
If you have asked this question of a vendor, a consultant or a search engine, you have probably been told that jewelry stores spend about 4.2% of revenue on advertising and marketing. It is specific, it is jewelry-specific, and it sounds like exactly the benchmark you were looking for.
It traces back to a Jewelers of America Cost of Doing Business survey, and the reporting of it is from 2008. [Stale]
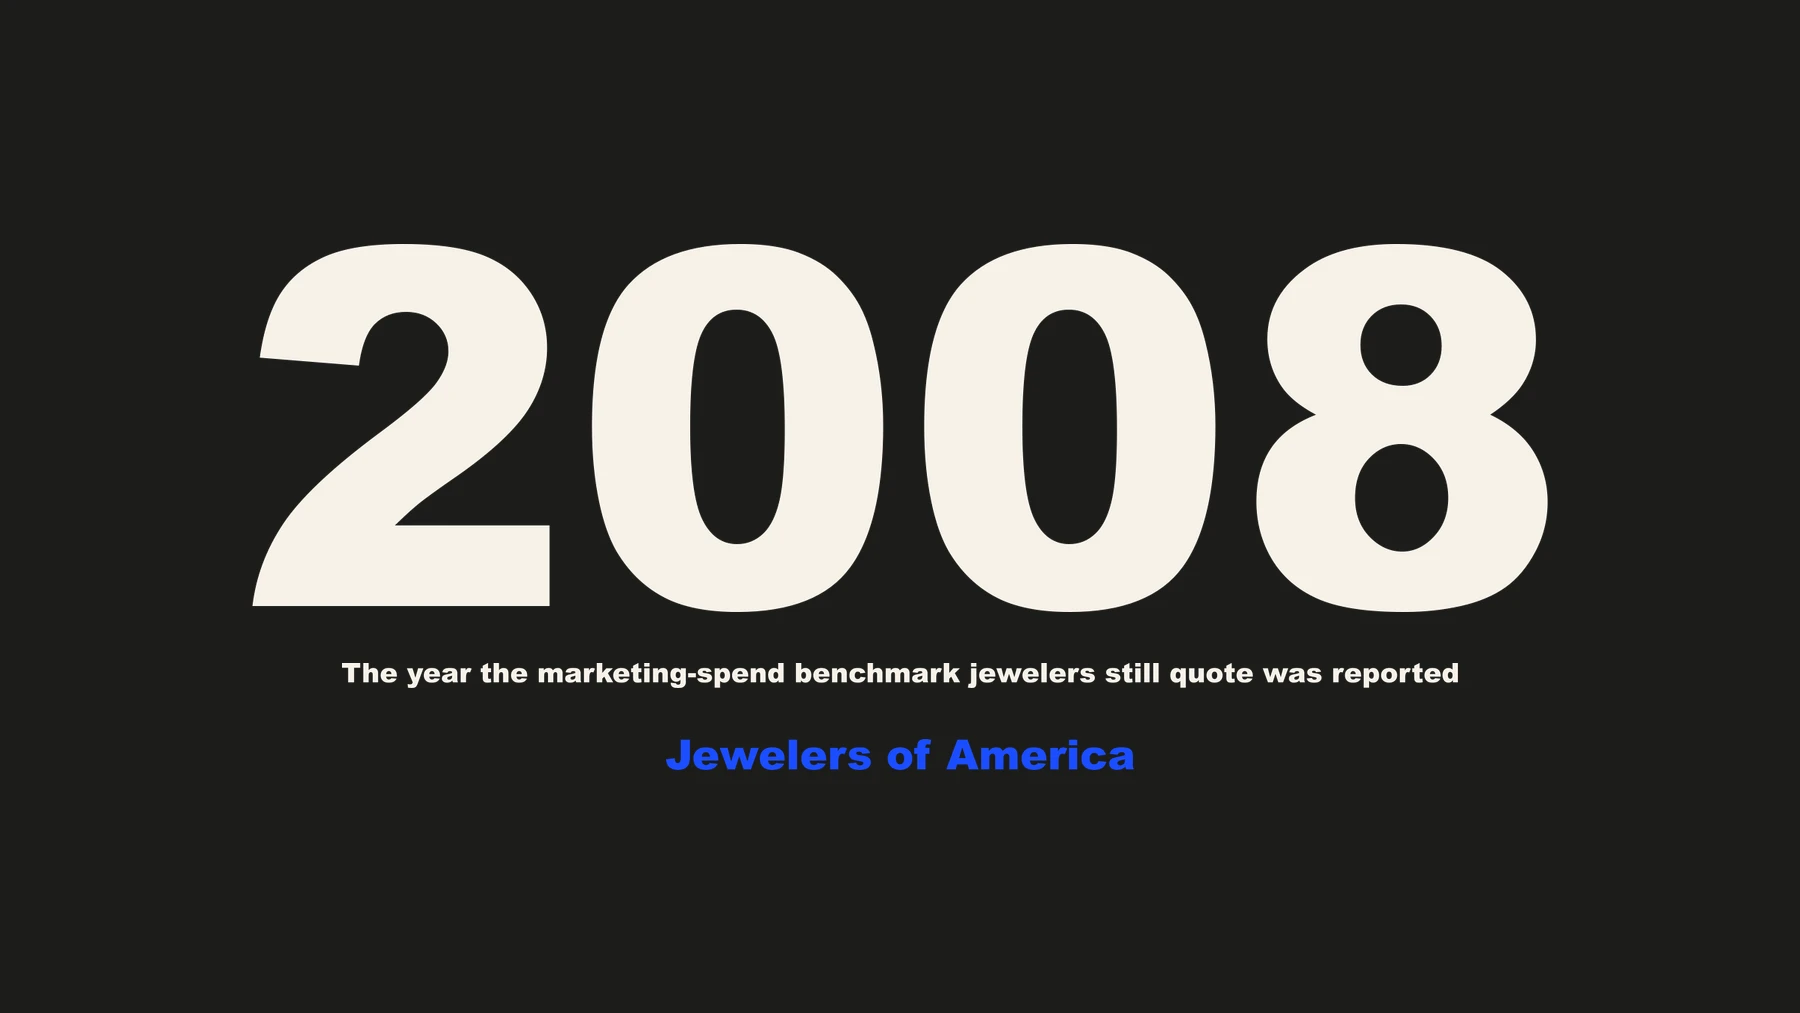
Consider what 2008 predates. The iPhone was a year old and the smartphone majority was years away. Instagram did not exist. Facebook had no advertising business worth the name, and the entire paid-social industry — the thing most of this budget now goes to — had not been invented. Lab-grown diamonds were not a retail category. A store's website was a brochure.
That figure is not wrong about 2008. It is describing a business that no longer exists, and it gets quoted as though it were current. It is the most repeated number in this category and the least usable.
There is no current, credible, jewelry-specific benchmark. We went looking properly, and what is out there is aggregation content: a percentage invented or misread somewhere, quoted by the next article, then the next, until it has the texture of a fact. That is the same pattern behind most jewelry social media statistics, which is covered at length in the state of independent jewelry retail in 2026.
So what is the honest range?
What is left is general retail guidance rather than anything specific to a jewelry store, and it lands in a wide band: 4% to 12% of revenue. Established stores of twenty years or more typically sit at the lower end, around 5% to 8%, and newer stores need to spend considerably more simply to become known. [Vendor guidance — directional]
That band is broad, and the breadth is not evasion. The right answer depends on which of two jobs you are doing:
- Defending a position. A store with thirty years of trade, a name people already say, and a repair bench that keeps the same families coming back is maintaining something. 5% to 8% is a maintenance figure.
- Building one. A store three years old, or one that has moved, or one whose owner has just changed, is buying awareness it does not have yet. That costs more than holding awareness you already earned, and the double-digit end of the range is where those stores live.
Nobody has measured where the crossover sits, or how long "new" lasts. Anyone who tells you precisely is guessing with a straight face.
What that actually looks like in dollars
Percentages are easy to nod at and hard to feel. Here is the same guidance as money, at 5% and at 8% of revenue, annually and monthly.
- $500,000 a year — 5% is $25,000, about $2,083 a month. At 8%, $40,000, about $3,333 a month.
- $750,000 a year — 5% is $37,500, about $3,125 a month. At 8%, $60,000, about $5,000 a month.
- $1,500,000 a year — 5% is $75,000, about $6,250 a month. At 8%, $120,000, about $10,000 a month.
- $2,500,000 a year — 5% is $125,000, about $10,417 a month. At 8%, $200,000, about $16,667 a month.
- $5,000,000 a year — 5% is $250,000, about $20,833 a month. At 8%, $400,000, about $33,333 a month.
The usual reaction to that table is that the numbers look far too big. Hold that thought, because it is usually half wrong.
Count everything before you conclude you are underspending
The percentage includes everything you spend to be known, not only the things with the word marketing on the invoice. Most owners, asked what they spend, name two or three line items and stop. Written out properly, the list is longer:
- Print — the local paper, the glossy regional magazine, the church bulletin, the school yearbook.
- Radio, and any local television.
- Sponsorships: the high school team, the charity gala table, the parade float, the golf day.
- The trade show booth, and the travel and hotel that go with it.
- Your website — hosting, the platform subscription, the developer who fixes it, the photographer.
- Directory listings, the chamber of commerce, shop-local advertorials.
- Boosted posts, and any paid social or search.
- Email and text-message tools, often bundled into the point-of-sale bill where nobody sees them.
- Window vinyl, signage, and bags and boxes with your name on them.
- Staff time. If a salesperson spends six hours a week on the page, that is roughly a fifth of a wage, and it is a marketing cost whether or not it is coded as one.
Add those up honestly before deciding you are underspending. A great many independents are already at or near 5%, distributed across a dozen things nobody ever chose deliberately — each one renewed because it renewed last year. The common problem in this channel is not the size of the number. It is that the number was never assembled in one place, so it has never been aimed.
Most stores do not have a marketing budget. They have twelve small habits that add up to one.
A better question than the percentage
Here is the part that matters more than any benchmark, and it comes from point-of-sale data across roughly two thousand US independents rather than from anybody's opinion. In 2025: gross sales rose 4.7%, unit sales fell 5.6%, and the average retail sale rose 10.9%, with gross profit up 5.5%. Then it intensified — transaction volume fell roughly 15% in the first quarter of 2026, while April sales came in 12% ahead of the prior April. [Measured]
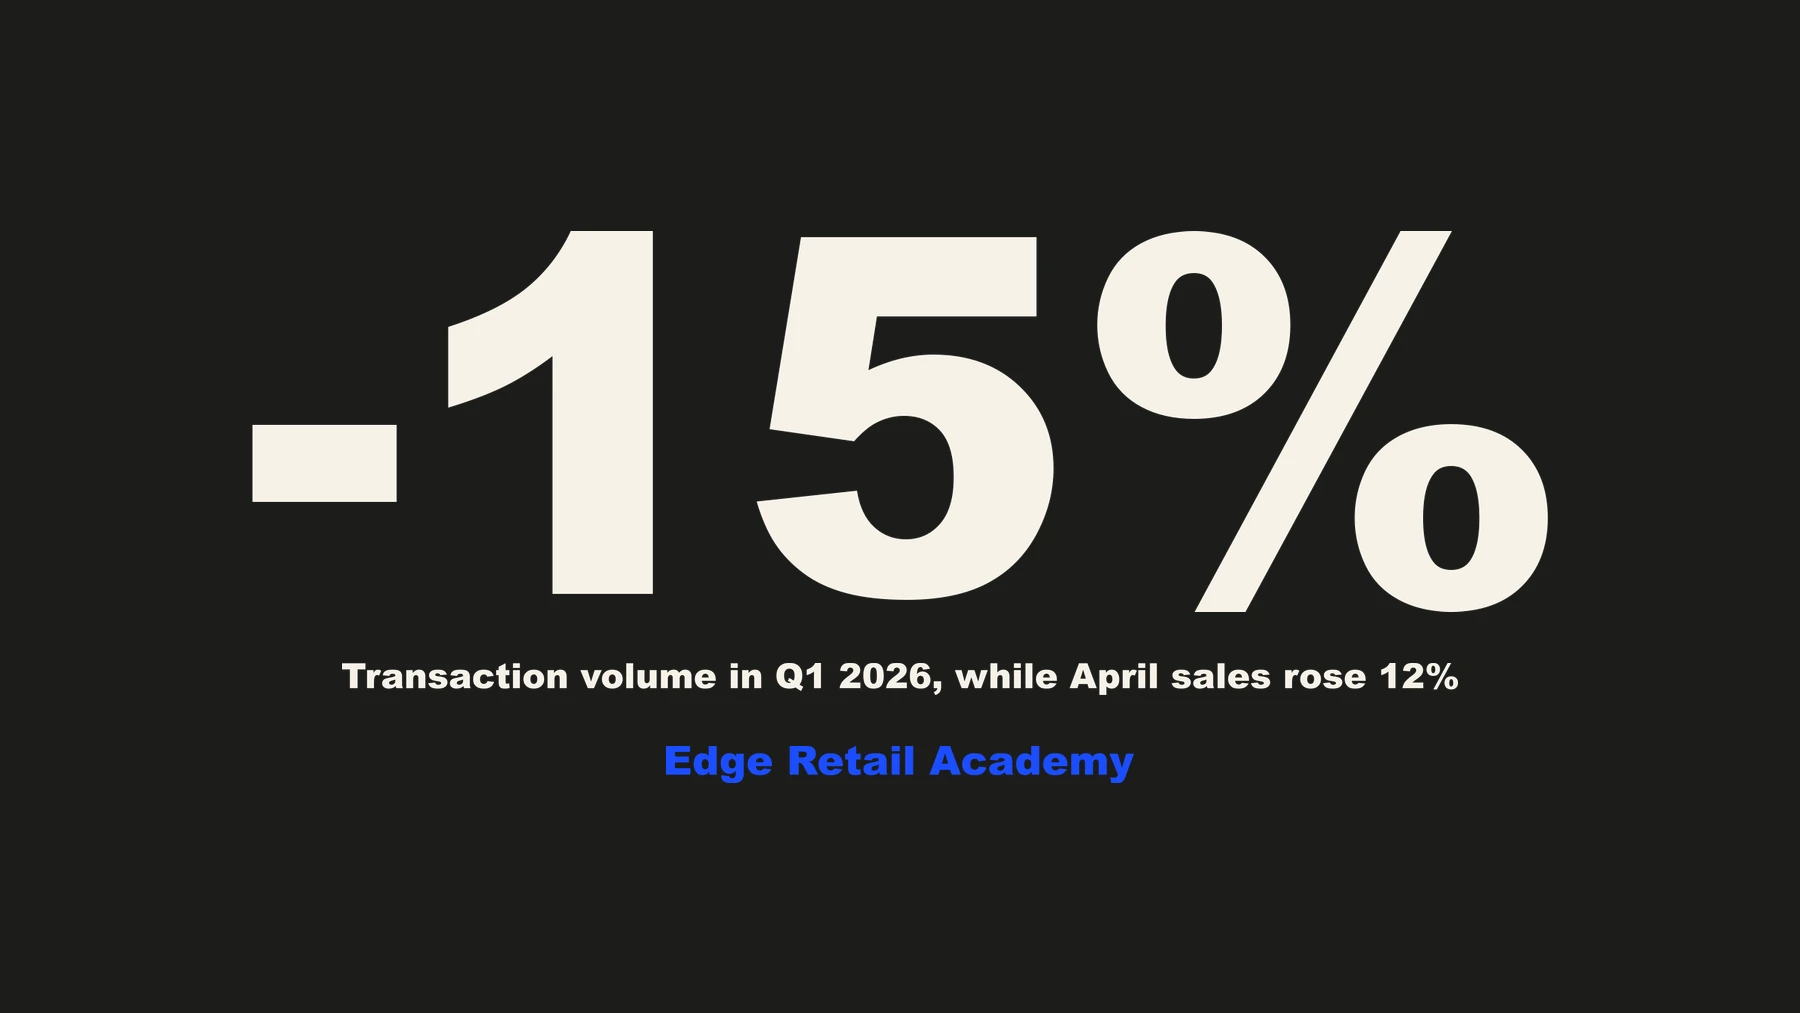
Read that carefully, because it tells you where a dollar belongs. Stores are having a good year on the top line while serving noticeably fewer people. The ticket is solved. The market has absorbed higher gold and diamond prices, and margins held. What got harder is getting a person through the door.
So the useful question is not how much you spend. It is how much of it is aimed at traffic.
Spending that lifts the ticket — the upgrade display, the finance messaging, the promotion on a piece somebody was already coming in for — is pointed at the half of the equation that is already working on its own. Discounting to fix a traffic problem is the clearest version of this mistake: it lowers the number that is rising and does nothing to the number that is falling.
If you audit one thing this quarter, audit what share of your marketing money is genuinely pointed at a first visit. In most stores it is a much smaller share than the owner expects.
Three line items that buy traffic cheaply
- Repair and remake marketing. Repairs and services grew 14% in 2025 against 4.7% for the channel overall — the fastest-growing line in the store, and the only one structurally immune to e-commerce. Every job brings a person in twice, to drop off and to collect. [Measured] Underneath it, 90% of jewelers report increased custom requests, and 65% of those involve melt-and-remake. [Survey — 117 jewelers] It is the cheapest traffic in the building and the least marketed thing in it.
- Photographing your own inventory. Recycled and duplicated imagery is penalised on reach, and reposting vendor photography is the standard independent workflow. This costs time rather than money, which is exactly why it never makes it into a budget — and it is a bigger lever than most things that do. [Measured]
- Answering every comment and message. 73% of consumers say they will switch to a competitor if a brand does not respond. "How much is this?" is an inbound purchase enquiry, as close to a phone call as social media produces. No platform reports it as a metric, so it goes uncounted, and what goes uncounted goes unanswered. [Survey]
And three that are worth less than they cost
- Scheduling tools bought for the "best time to post." The claim that the first thirty minutes of engagement determines a post's reach has never been measured by anyone, no platform has named it as a ranking input, and not one vendor publishes an effect size. The two largest vendors in the timing business disclaim their own findings. [Not measured]
- Sharing links as posts. Link posts underperform every other Facebook format by three to four times, on two independent large samples. If your process is "write something, share the link," that is the weakest available use of the platform. Put the content in the post. [Measured]
- Boosting the supplier's photograph. You are paying to distribute an image four hundred other stores also posted, into a system that penalises duplicated imagery. Boost your own picture of your own piece instead, even an indifferent one.
The budget year and the buying year are not the same shape
One thing that quietly wastes a correctly-sized budget: spending it evenly. Jewelry is among the most seasonally concentrated categories in retail, and the lead times are longer than almost anyone plans for.
- About 47% of engagements happen November to February, and 57% of proposers begin researching more than six months out. [Measured — n=10,474 couples] That puts bridal content live from roughly 1 June for the following season — 26 weeks of continuous presence. A store that starts posting engagement rings in November is arriving after most of that season's buyers have already decided where to look.
- Christmas consideration is seeded in September and October, which makes those the months for education and authority content rather than product pushes.
- Valentine's Day and Mother's Day together are about 16% of annual sales. [Measured] Valentine's work is built in January, Mother's Day in March.
- Summer is slow retail and the peak window for repair and restoration content — the slack months are when repair marketing earns most, because it is the category that produces walk-ins when nothing else does.
The practical consequence for a calendar-year budget is uncomfortable. The June line — bridal content for a season six months away, with nothing to show for it until December — is the easiest line to cut in a quiet summer, and it is the one that costs the most to lose. If you are setting next year's number now, decide that June figure now too, while the reason for it is still legible.
If you want one number
There is not a defensible one, and the honest answer is more useful than a confident one:
- Assemble what you already spend, including staff hours. Most owners find it is larger than they thought and less deliberate than they hoped.
- If you are an established store, 5% to 8% of revenue is the defensible band. If you are building rather than defending, expect to be above it.
- Then spend the real effort on the split rather than the total: what share of it is aimed at a first visit.
- Protect the June bridal line and the repair line from the reflex to cut them, because both pay out in a different quarter from the one they cost in.
Nothing in the measured data says an independent jeweler needs a bigger budget. It says the ticket is already working, traffic is not, and a striking share of what stores currently spend is aimed at the half that needs no help.
Get this for your own store
The hardest part of that audit is knowing what share of your spend is aimed at a first visit, and that depends on who actually lives in your trade area. A strategy built from your own postal codes and the published Census figures for them is free at myjewelrymarketing.com/demo/strategy — paste your website address and read it in a couple of minutes.
Sources
Compiled by My Jewelry Marketing — myjewelrymarketing.com.
- Sales, units and average sale. Edge Retail Academy point-of-sale data from approximately 2,000 US jewelry retailers, via INSTORE Magazine and National Jeweler — 2025 full year and monthly 2026 reporting.
- Repairs, custom and melt-and-remake. Edge Retail Academy via INSTORE for the 14% category growth; INSTORE "Jewel360 Report," 28 July 2026, survey of 117 jewelers, for the 90% and 65% figures.
- The 4.2% figure. Jewelers of America Cost of Doing Business survey via IDEX Online, reported for 2008. Quoted here to date it, not to use it.
- The 4% to 12% range. General retail and marketing-vendor publications without disclosed methodology. Directional only, and labelled as such.
- Format performance. Buffer, The State of Social Media Engagement in 2026 — 52 million posts across 200,000 accounts, January 2024 to December 2025 — for link-post underperformance; Socialinsider's Facebook benchmarks and Dash Social for the wider format work. Platform documentation, vendor research and academic databases were searched for any published effect size on posting time, and none exists.
- Responsiveness. Consumer survey reporting via Sprout Social.
- Bridal and seasonality. The Knot 2026 engagement research via Rapaport, 19 February 2026, n=10,474 couples.